

Evidence-based policy development: A framework and its application
There has been considerable interest and debate recently on the use of evidence in policy development, sparked perhaps by a view that some governments overly rely on ideology rather than evidence to make policy decisions. Yet, when asked, virtually everyone says they support evidence-based policy.
By Munir A. Sheikh, Former Chief Statistician of CanadaBut even if there is widespread agreement, a discussion and examination of the issue serves two useful purposes:
- First, it helps clarify exactly what we mean that policy development needs to be based on evidence and how one actually goes about doing it; and,
- Second, such a discussion helps clarify the distinction between basing policy decisions on evidence and creating evidence to support a policy decision already made. The former is desirable and does not happen often enough, while the later is undesirable and occurs frequently.
There are several ingredients to making policy decisions. The most critical are evidence and leadership. This paper offers a framework to capture and apply them both. Other factors, such as political and ideological considerations, as well as conflicting evidence, are not directly addressed but are subsumed in the role of leadership in the pursuit of sound public policy. For the purposes of this discussion, Section 2 examines evidence and provides an example of what it means. Section 3 combines evidence with leadership and applies the framework to a range of policies that have been of interest to Canadians in recent years. Section 4 draws key conclusions.
Example of evidence-based policy: climate change
In 1920, the great economist Arthur Cecil Pigou argued that when an economic activity creates external disservice (such as pollution), a properly designed tax improves, not worsens, resource allocation and makes an economy stronger and more efficient. This is the foundation for the case supporting a carbon tax from an economic theory perspective.
Those who worry about the negative environmental effects of burning fossil fuels support a carbon tax purely from the perspective of achieving their environmental objectives. The carbon tax issue is an example of the starting point for evidence-based policy development: a clear hypothesis, grounded in economic and environmental theories, about the nature of a relationship between the two factors.
Many worry about the negative economic impact of a carbon tax, arguing it would “destroy” jobs. Using Pigou’s position that a properly designed tax actually improves economic performance, these views do not stand the test of reason or evidence.
The second step in evidence-based decision-making is determining what the evidence shows about the impact of a carbon tax? Let’s look at the performance of a number of countries with high carbon taxes, a list that includes Sweden, Norway, Denmark and the Netherlands (one may also examine the case of British Columbia). Added to the group is the average performance of the OECD area (a collection of 34 developed countries), the United States and Canada. Also examined are several environmental indicators, such as the share of environmental taxes in total taxes, the environmental taxes-to-GDP ratio, the energy and materials intensity of production and consumption, and the growth of greenhouse gas emissions.
On the economic front, there are two key economic variables: the level of per capita GDP as an indicator of the current standard of living; and, labour productivity growth over time, as an indicator of potential growth in living standards in the future. To not ignore social outcomes, included is income distribution across income groups using the Gini coefficient, which captures income inequality. The data is from the OECD over the 1990 to 2012 period. Not included are variables such as Canada’s diseconomies of geography - such as climate, distance and scattered populations, as well as Canada as a producer of resources that others nations consume.
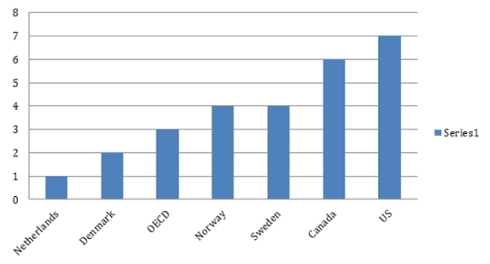
In total, there are eight indicators and seven jurisdictions in the following charts which rank countries. Chart 1 on the ratio of carbon tax-to-GDP shows that the Netherlands is ranked first as it has the highest ratio, whereas the US is seventh and Canada sixth.
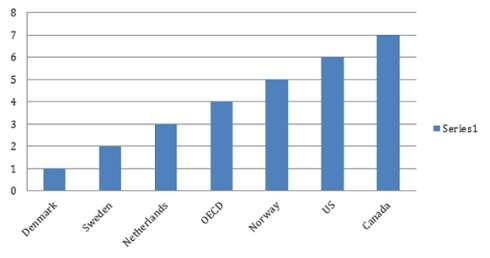
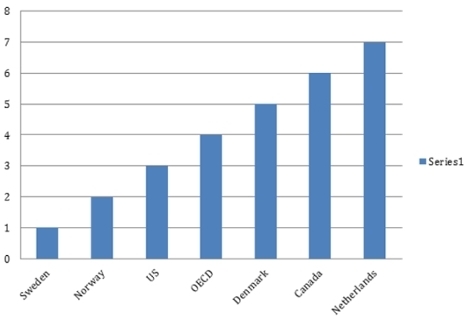
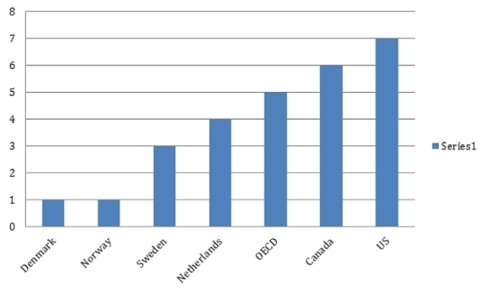
In Chart 2, Canada is ranked the worst on greenhouse gas emissions (meaning it has the highest emissions per capita) and is the second worst on productivity growth and income distribution (Charts 3 and 4).
To get a better overall picture, also shown are the rankings that result from the eight indicators. Based on the seven jurisdictions, the worst possible score is 56, if a country were at the bottom for each of the indicators and the best possible score is 8. Chart 5 provides the composite indicator, with rankings based on the eight indicators for seven countries.
The data show that Canada is not doing well in relation to any of the six other jurisdictions for environmental, economic or social outcomes. In this ranking, Canada scores 48, worst of the group.
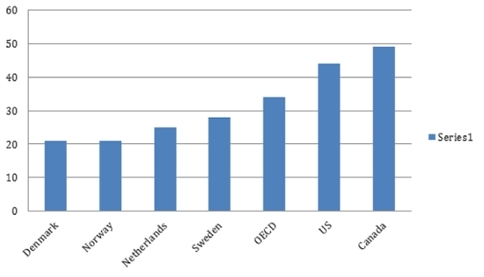
The U.S. scores 44. The best of the group is Denmark, at 20.
The results lead one to the conclusion there is no reason to believe that there need to be trade-offs between the economy and the environment. The one necessary assumption is that, given the differences in each of the national economies, one must, as in every policy situation, design policies appropriately to achieve this result. Badly designed policies will not achieve the theoretical result one would expect.
It’s important to note that this evidence does not establish causation – specifically that environmental taxation generates better economic and social outcomes. It does show, however, that environmental goals are achievable at the same time as economic and social goals.
An evidence-leadership framework
This evidence, consistent with economic theory, raises two questions: why is it that evidence-based good policies are sometimes not implemented; and, why certain policies are implemented that are not supported by evidence? This leads to a second critical element to policy development that needs to be considered: leadership, specifically political leadership.
For the purposes of this discussion, leadership is the will and the ability to take policy action that is good for the country as a whole, but may not be popular among certain sections of the population. It can be opposed because of negative effects on a certain group, or negative effects in the short term that would be more than offset in the long run. It can also be opposed for ideological reasons, regional considerations, or a simple lack of understanding of the underlying issues that should be correctable with appropriate communication. The degree of leadership required depends on the strength of the challenge to be faced by the government.
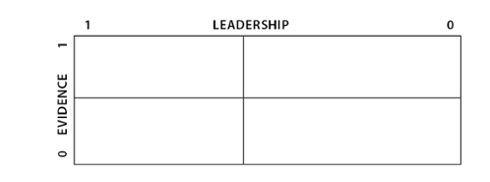
Chart 6 presents this leadership-evidence framework as a 2X2 schematic, with leadership at the top and evidence on the vertical axis. As you move towards the right in Chart 6 from 1 to zero on the leadership scale, the degree of leadership needed diminishes—the issues are simpler. On the vertical axis, as you move down from 1 to zero, the amount of evidence supporting the policy being considered diminishes, so that that policy becomes less and less appropriate.
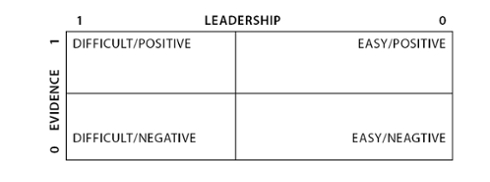
Chart 7 summarizes these observations in the four quadrants: the top left policies have positive economic outcomes, but are difficult (to implement); the top right policies are positive and easier; the bottom left policies are negative and difficult; while the bottom right policies are negative and easier.
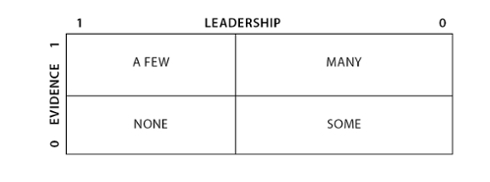
Given these combinations, what should one expect from governments on the policy front? Chart 8 provides the answer, admittedly with the caveat that what are listed as “positive” policies would not be accepted as such by everyone, which is the nature of the challenge for policy decisions by elected officials. Expect to see a few policies in the top left; many in the top right; none in the bottom left and some in the bottom right. In contrast to this expectation, what is the actual experience?
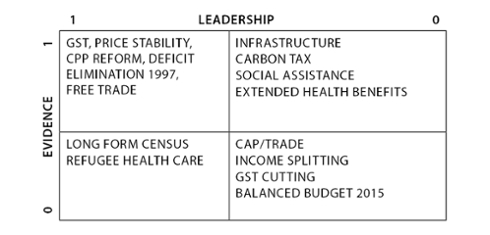
Chart 9 provides perspective of where a number of key policies that have been implemented belong. Governments in the past have been able to implement sound evidence-based policies such as the introduction of the GST, price stability, CPP reform, the 1997 elimination of the deficit, the Canada-US Free Trade Agreement (the FTA), and the North American Free Trade Agreement (NAFTA). As well, governments have not implemented many positive policies that one could argue would be relatively easy to implement (top right quadrant), including infrastructure spending, a carbon tax, reform of social assistance and extended health benefits.
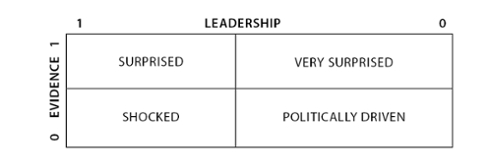
In contrast governments have also implemented policies lacking an evidence base that also require strong leadership. Two recent policies in this area were the elimination of the long-form census, and cuts to refugee health care. The former led to less data of questionable quality and at a higher expense; the later leading to worse health outcomes, again at a higher expense, albeit paid by provinces to a considerable extent. The new federal government moved swiftly to cancel both these policies, as their reversal did not require a huge amount of leadership as defined above. The right bottom quadrant includes policies that lack a sound evidence base and are easy to implement, including cap and trade, income splitting, the GST cuts and the commitment to balance the federal budget in 2015. Based on the leadership-evidence axis, Chart 10 subjectively labels actual outcomes in Chart 9 with expectations in Chart 8.
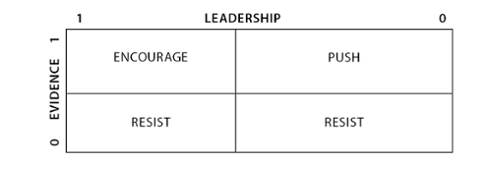
Based on the leadership-evidence four quadrants, Chart 11 sets out in simple terms the role of stakeholders to help improve the Canadian policy agenda.
Conclusions
In conclusion, evidence-based policy development should lead to better economic and social outcomes and improve the general welfare. Indeed, such an approach can help avoid at times some of the trade-offs between multiple objectives that we would simultaneously want to achieve. One note of caution is that because everyone favours using evidence, policymakers should be careful that evidence is being used to develop policies that reach their objective, not that policies are being developed first and evidence is gathered after to justify them.
The type of evidence-based policy framework described earlier should be helpful in getting politicians and other policymakers to think more clearly in making their policy choices, and providing leadership in introducing effective public policies that achieve their economic and social goals.
Munir Sheikh

Munir Sheikh is an Executive Fellow at the School of Public Policy at the University of Calgary. He recently served as a co-Commissioner of Ontario’s Social Assistance Review, which submitted its Report to the Government of Ontario on transforming the program in October 2012. He served the Government of Canada in many senior level positions including the Chief Statistician of Canada, Deputy Minister of Labour, Deputy Secretary to the Cabinet, and Expenditure Review at the Privy Council Office. Mr. Sheikh holds a Doctorate in Economics from the University of Western Ontario and a Masters in Economics from McMaster University. He has published extensively in academic journals in the areas of international economics, macroeconomics and public finance.
People who are passionate about public policy know that the Province of Saskatchewan has pioneered some of Canada’s major policy innovations. The two distinguished public servants after whom the school is named, Albert W. Johnson and Thomas K. Shoyama, used their practical and theoretical knowledge to challenge existing policies and practices, as well as to explore new policies and organizational forms. Earning the label, “the Greatest Generation,” they and their colleagues became part of a group of modernizers who saw government as a positive catalyst of change in post-war Canada. They created a legacy of achievement in public administration and professionalism in public service that remains a continuing inspiration for public servants in Saskatchewan and across the country. The Johnson-Shoyama Graduate School of Public Policy is proud to carry on the tradition by educating students interested in and devoted to advancing public value.