

Low Indigenous Employment and “Deaths of Despair” in the Canadian Prairies
In all communities, whether defined by race, ethnicity, or class, an important dimension in explaining social pathologies, such as homicide and suicide, is low employment.
By John Richards, Professor of Public Policy, Simon Fraser UniversityDownload the JSGS Policy Brief
Over the last half-century, non-Indigenous Canadians have become more aware of the impacts of colonization on Indigenous communities. Progress has been made between Indigenous and Non-Indigenous people by beginning to honour treaties and working towards improved social conditions on- or off-reserve. However, the association between low employment and high Indigenous homicide and suicide rates—rates which are highest in the Prairie provinces and northern territories—has not been addressed.1
In all communities, whether defined by race, ethnicity, or class, an important dimension in explaining social pathologies, such as homicide and suicide, is low employment. In addition to poverty due to low employment, the lack of meaningful employment leads many to commit suicide or engage in domestic violence. In the context of US rust belt states, Angus Deaton and Anne Case (2020) have labelled this syndrome “deaths of despair”. (See Box 1 for a brief introduction to their analysis.)
|
“Death of Despair” William Julius Wilson figures prominently among those who insist on employment opportunities as a high priority in addressing the distress of marginalized communities. An American sociologist, much of Wilson’s early research analyzed the role of unemployment in the context of American inner-city ghettos. Writing in 1996, he summarized: |
Homicide
In seven non-Prairie provinces, Indigenous homicide victim rates are two to three times that of non-Indigenous people (1.45 per 100,000, annual average 2017-21). In the Prairie provinces, Indigenous homicide victim rates are ten times higher. Indigenous homicide victims are a quarter of all homicides in Canada, a dramatic over-representation relative to the Indigenous share of the Canadian population.
Figure 1: Indigenous homicide victim rates, Canada and selected provinces, non-indigenous rates, Canada, 2014-2021
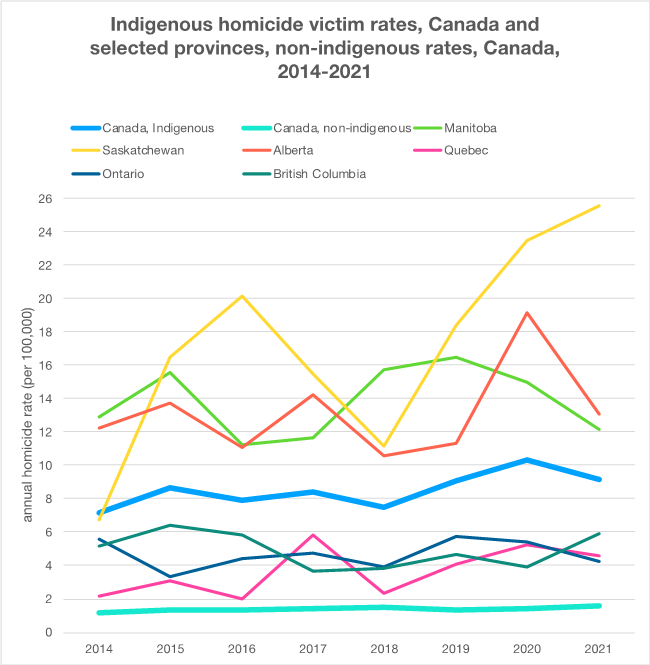
Figure 2: Distribution of Indigenous homicide victims, by province and territories, 2017-2021, percent and count (n=877)
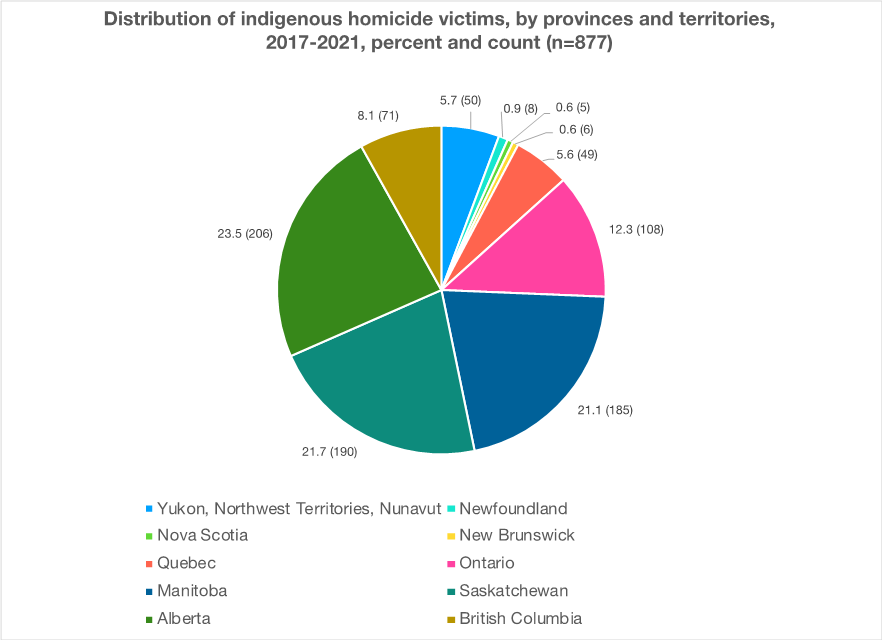
Figure 1 illustrates trends, since 2014, of Indigenous homicide victim rates in six provinces and at the national level. The figure also includes the non-Indigenous trend at the national level. Figure 2 illustrates the distribution among provinces and territories of the 877 Indigenous homicide victims over the five years, 2017-21. Two-thirds of these homicides took place in the Prairies.2
How to explain? Samuel Perrault (2022) provides a detailed summary of data on Indigenous homicide and a partial explanation:
Throughout the world—from the northeastern tribal states of India, to Australia, New Zealand, Latin America, and northern Scandinavia—Indigenous communities have experienced serious social trauma and domestic violence in the wake of non-Indigenous “settlers”.
Since the 1996 report of the Royal Commission on Aboriginal Peoples (RCAP), the dominant agenda in Canada among Indigenous and non-Indigenous political leaders, among academics, and among policy analysts has been rehabilitation of First Nation communities via expansion of treaty rights (Canada 1996, x-xi.).
Implicit in Perrault’s article is that intergenerational trauma plus continuing white racism is a sufficient explanation for Indigenous distress, and that RCAP, supplemented by subsequent studies, provides an appropriate agenda. Also implicit to the agenda is that closing socio-economic gaps between First Nation and other communities can be subsumed under strategies designed to affirm treaty rights that strengthen First Nation reserves.
Harold Johnson (2016), a prominent First Nation lawyer and writer, served for two decades as crown prosecutor in northern Saskatchewan. His memoir, Fire Water, emphasizes alcohol as a proximate explanation.3 He refers to colonialism and residential schools, but he refuses to explain social problems solely in terms of past history: “If we believe that the only reasons for our problems rest with colonization, we can never fix our problems, because we cannot go back and fix colonization. We cannot go back and change residential schools.” His book is a passionate plea for Indigenous and non-Indigenous leaders to tackle the abuse of alcohol and drugs in First Nation communities.
The RCAP places little weight on the desire for good education leading to employment in the mainstream economy. Probably, the best evidence on the desire for education and employment among many Indigenous people comes from the large-scale survey of 2,600 urban Indigenous people (Métis and Inuit, as well as First Nation) undertaken for the Urban Aboriginal Peoples Study:
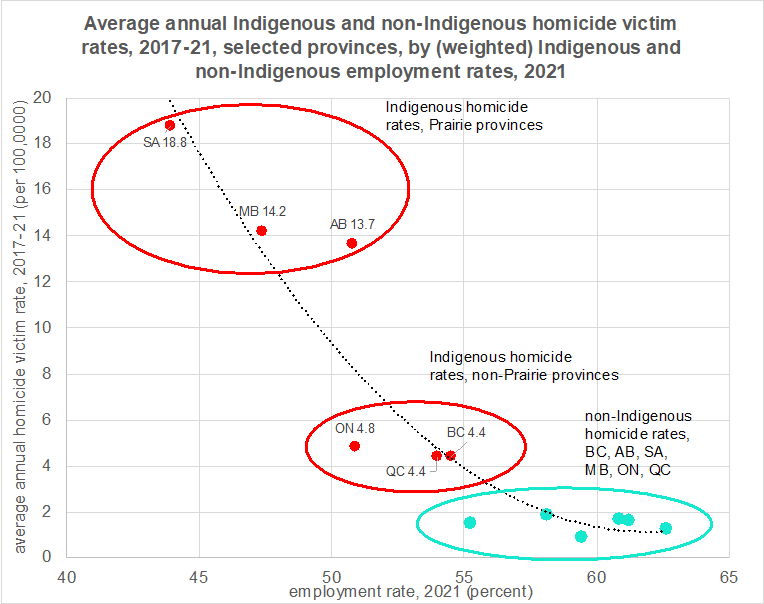
Figure 3: Average annual Indigenous and non-Indigenous homicide victim rates, 2017-21, selected provinces, by (weighted) Indigenous and non-Indigenous employment rates, 2021
Employment Rate, Canada and provinces, 2021 (percent)
| First Nation | Métis | |
| Canada | 46.3 | 57.5 |
| Newfoundland | 47.5 | 50.7 |
| Nova Scotia | 47.4 | 53.1 |
| New Brunswick | 49.1 | 50.2 |
| Quebec | 53.0 | 56.6 |
| Ontario | 48.7 | 55.5 |
| Manitoba | 37.3 | 59.6 |
| Saskatchewan | 35.5 | 58.4 |
| Alberta | 43.9 | 58.1 |
| British Columbia | 51.2 | 60.4 |
Note: Statistics Canada data distinguish between First Nation and Métis employment rates, but do not distinguish between First Nation and Métis homicide victim rates. In the scatterplot, the estimated Indigenous employment rate of a province is the weighted sum of the relevant First Nation and Métis employment rates. The provincial weights vary according to the distribution of the province’s Indigenous population between First Nation and Métis. The trendline is a quadratic equation: y = 0.06x2 – 7.12x + 221.51 (R2 = 0.89), where x is provincial employment rate and y is average annual homicide victim rate.
Figure 3 is a scatterplot showing average 2017-21 Indigenous homicide victim rates for six provinces, by provincial Indigenous and non-Indigenous employment rates.4 The trend line is non-linear, which implies that reductions of employment rate have only a small impact on homicide rates when the employment rate is high, as is the case among non-Indigenous populations. The lower the employment rate, the larger is the expected incremental impact on homicides from further declines in employment. Conversely, an increase in employment rate in the Prairie provinces can be expected to have a much greater impact in reducing homicides than an employment increase in a non-Indigenous population. The trend line is far from definitive, but it provides evidence that low Indigenous employment rates are a relevant factor in explaining why Indigenous homicide rates are much higher in the Prairies than in the three other provinces. An argument based on history alone cannot explain the large interprovincial variations.5 Admittedly, outcomes in two of the three northern territories (Yukon and Northwest Territories) are not consistent with the association noted between low employment and high homicide victim rates in the six provinces; outcomes in Nunavut are consistent.6
The report of the National Inquiry into Missing and Murdered Indigenous Women and Children (2019) focused on the fact that the female Indigenous victim rate is much higher than that of non-Indigenous women (see Table 1). Over the five years 2017-21, the ratio is over six. While this statistic obviously deserves publicity, the inquiry paid scant attention to other gender statistics. Over 2017-21, the ratio of the Indigenous male to non-Indigenous male homicide victim rate is also over six. Three-quarters of Indigenous homicide victims are men. The evidence on the relation of homicide perpetrators to their victims is similar among both the Indigenous and non-Indigenous populations. Only a minority of homicide perpetrators are strangers to their victims, 18% among non-Indigenous and 8% among Indigenous victims. The great majority of homicide perpetrators, whether Indigenous or non-Indigenous, are spouses, family members, friends, or acquaintances of their victims (see Table 2). Not surprisingly, given the over-representation of Indigenous victims and the nature of connections between victim and perpetrator, Indigenous perpetrators are also disproportionately high.
Table 1: Average annual homicide victim counts and rates, Canada, by gender and identity, 2017-2021
| Count | Rate a. | |
| Total b. | 713.0 | 1.902 |
| Indigenous | 175.4 | 8.880 |
| Non-Indigenous | 515.0 | 1.448 |
| Male, total | 535.0 | 2.868 |
| Indigenous | 131.8 | 13.464 |
| Non-Indigenous | 387.2 | 2.194 |
| Female. total | 174.2 | 0.922 |
| Indigenous | 43.4 | 4.362 |
| Non-Indigenous | 125.6 | 0.704 |
Notes: a. Rate is calculated in terms of count per 100,000 in relevant population. b. Identity counts do not add to relevant totals due to the omission of victims whose identity was not determined.
Source: Statistics Canada, Table 35-10-0156-01
Table 2: Relationship of homicide perpetrators to homicide victims
| Indigenous | Non-Indigenous | Difference | |
| percent | percentage points | ||
| Spouse | 9.2 | 12.4 | -3.2 |
| Other family relationship | 23.6 | 15.6 | 8.0 |
| Other intimate relationship | 5.5 | 5.1 | 0.4 |
| Acquaintance | 40.9 | 32.0 | 8.9 |
| Criminal relationship | 8.2 | 9.0 | -0.8 |
| Stranger | 8.3 | 18.5 | -10.2 |
| Relationship unknown | 4.3 | 7.4 | -3.1 |
Source: Statistics Canada, Table 35-10-0119-01
Suicide
A frequently cited article on suicide among the Indigenous population is Chandler and Lalonde’s (1998) study of suicide in BC. The authors established the residence of each Aboriginal suicide in one of 29 tribal councils. Using an index of “cultural continuity” that each tribal council achieves (based on measures such as the percentage of children attending on-reserve schools and the extent of band control of health and other services), the authors found that the higher the tribal council’s cultural continuity, the lower the suicide rate. There is no denying that “cultural continuity” matters. The problem with this study is the same as Perrault’s: both invoke a single factor.
The 2017 report of a parliamentary committee on suicide contained a passionate passage on the importance of employment:
JSGS Policy Brief continues below advertisement.

What can be done – quickly?
Well-governed First Nation communities with access to business opportunities—for example, those with treaty rights relevant to development of resource projects—are realizing employment benefits and some of the profits (Aragon 2015; Flanagan 2019). However, such communities are a small share of the total. Doubtless, affirmation of treaties and Indigenous culture over the last quarter century has been valuable. More can be done by federal and provincial governments to increase on-reserve employment options in private resource developments and government infrastructure projects across northern Canada. It would also be useful to decentralize government offices to northern regions. Feir and Thomas (2019) find that good child care, combined with reasonable education, increased labour force participation among Inuit women in Quebec.
Such initiatives cannot meaningfully reach most who are currently living in rural First Nation communities. For many, out-migration is a reasonable choice. In the 2001 census, 45% of those who identified as First Nation lived on-reserve; according to the 2021 census, only 30%.
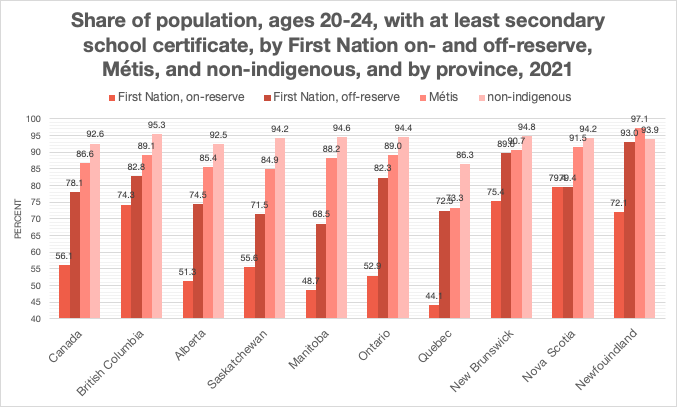
Those eligible to live on-reserve and wanting to do so should have reasonable employment prospects. Some on-reserve jobs require skills transferred across generations, and formal schooling is less necessary. High on-reserve unemployment rates are a measure of excess on-reserve supply of those with incomplete high school wanting such jobs. Among non-Indigenous young adults (ages 20-24), over nine of ten have achieved high school certification, and the majority are undertaking some form of post-secondary education. Among on-reserve First Nation adults in this cohort, the national share with high school certification is slightly over half; the rates in the three Prairie provinces are all below the national average (see Figure 4). An immediate reform, advocated for many years by Harvey McCue (2016), is adaptation of K-12 curricula for schools with large Indigenous student cohorts, and increase in vocational courses.
Figure 4: Share of population, ages 20-24, with at least secondary school certificate, by First Nation on- and off-reserve, Métis, and non-Indigenous, and by province, 2021 (by percent)
Despite the prospect of low earnings and low employment among those without high school, many are migrating off-reserve. As to be expected, young adults with high school certification are more likely to “go to town” than those without. For First Nations, Métis, and non-Indigenous, employment rates increase by over 20 percentage points among those with high school certification relative to those without (see Figure 5). Employment rates rise, more slowly, at higher education levels. Simultaneously, median earnings rise at higher education levels (see Table 3).
Controlling for education levels, full-time full-level employment, and age cohort, overall median Métis earnings are at or above median non-Indigenous earnings; overall median First Nation earnings are about ten percentage points below non-Indigenous earnings. The Métis earnings are an optimistic rarely noted statistic. In the Prairies, the Métis median earnings are similar to the relevant provincial non-Indigenous median, not so among First Nations. Admittedly, there are several interpretations of the Prairie results: employee seniority, questionable quality of education, and racism.
Figure 5: Employment rate, by identity and highest education level, 2021
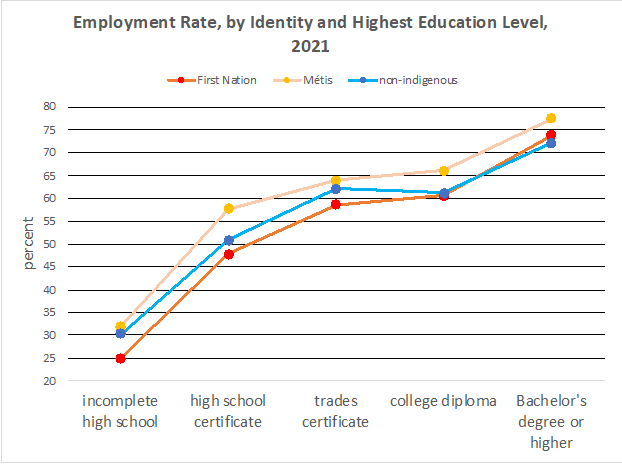
Table 3: Median employment earnings, full-time full-year, Canada and Prairies, by identity and highest education level, ages 25-64, 2020
| First Nation | Métis | Non-Indigenous | First Nation | Métis | |
| Canada | dollars | percent of non-Indigenous median | |||
| Incomplete high school | 40,000 | 49,600 | 45,600 | 87.7 | 108.8 |
| High school certification | 48,000 | 55,600 | 54,000 | 88.9 | 103.0 |
| Post-secondary certification | 62,000 | 71,000 | 72,000 | 86.1 | 98.6 |
| Manitoba | |||||
| Incomplete high school | 34,000 | 47,600 | 46,400 | 73.3 | 102.6 |
| High school certification | 40,400 | 52,800 | 51,600 | 78.3 | 102.3 |
| Post-secondary certification | 55,200 | 70,500 | 66,500 | 83.0 | 106.0 |
| Saskatchewan | |||||
| Incomplete high school | 36,000 | 45,600 | 47,600 | 75.6 | 95.8 |
| High school certification | 42,000 | 55,600 | 54,800 | 76.6 | 101.5 |
| Post-secondary certification | 60,000 | 71,500 | 73,000 | 82.2 | 97.9 |
| Alberta | |||||
| Incomplete high school | 41,600 | 56,400 | 53,200 | 78.2 | 106.0 |
| High school certification | 54,000 | 60,400 | 60,400 | 89.4 | 100.0 |
| Post-secondary certification | 68,500 | 79,000 | 81,000 | 84.6 | 97.5 |
Note: Percentages are Indigenous full-time full-year median earnings relative to regional non-Indigenous median earnings.
Source: Statistics Canada, Table 98-10-0427-01
What can be done – with patience?
To realize “middle-class” incomes, most young Canadian adults achieve by age 35 some form of post-secondary education—trade certification, college diploma, or university degree at the Bachelor’s level or higher. Ranking OECD countries, the Canadian education system performs relatively well in enabling adults to achieve post-secondary education. Among adults with post-secondary education (ages 25-34), Canada ranks second, well above the OECD average, 44% (OECD, 2019, Table A1.2).
Figure 6: Share of population, ages 25-35, with post-secondary certification, by First Nation on- and off-reserve, Métis, and non-Indigenous, and by province, 2021
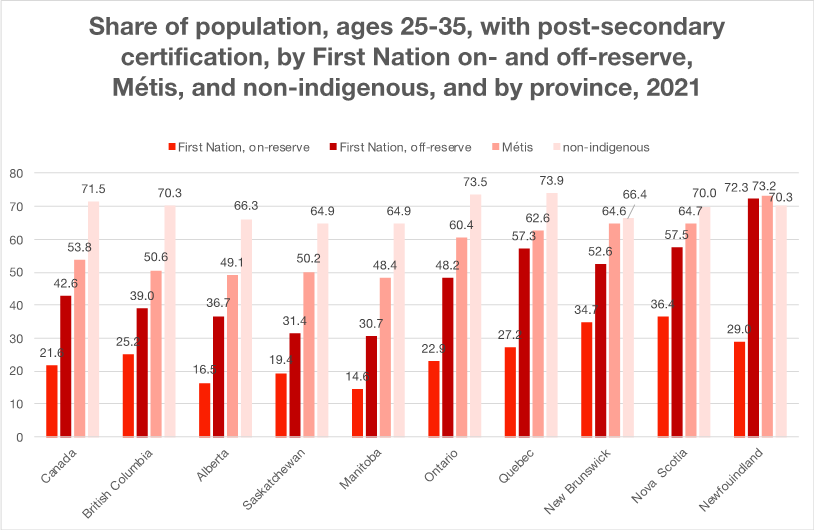
The optimistic Canadian statistic on secondary plus post-secondary among young adults ages 25-34 does not apply to Indigenous Canadians. While many educators across Canada are diligently teaching Indigenous students, and census education results are somewhat better in 2021 than in 2016, progress is unacceptably slow10 Based on this statistic as highest education level in the ages 25-34 cohort, 71.5% of non-Indigenous meet the threshold. Among Métis, 53.8% meet the threshold. The four western provinces are slightly below the national Métis average; those in Ontario and further east are above. As in the case of high school completion, the off-reserve share among First Nations is much higher than those on-reserve. Again, off-reserve Prairie provinces are substantially below the national average (see Figure 6).
It is highly unlikely that median earnings in First Nation communities can ever converge on the non-Indigenous statistics without a major improvement in First Nation education levels. The First Nation critique of government education interventions from, say, the Indian Act of 1876 to mid-20th century is obviously legitimate, but extending mistrust to current initiatives has become an obstacle to improving Indigenous education outcomes. With the needed qualifications, Harvey McCue, a senior First Nation educator with a national reputation, bluntly identifies mistrust as a problem:
As Johnson insisted in his memoir, we cannot undo the past. If ever we are to achieve Indigenous earnings similar to non-Indigenous earnings, First Nation leaders must prioritize and promote quality education. A decade ago, Chuck Strahl, federal minister of Indigenous affairs, and Shawn Atleo, national chief of the Assembly of First Nations, initiated an ambitious project to strengthen the management of reserve schools. The initiative culminated in 2014 with a substantial increase in federal funding of reserve schools and legislation (The First Nations Control of First Nations Education Act, Bill C-33) tabled in Parliament. The essence of the bill was to nudge First Nation councils into professionalizing on-reserve school management and acknowledging that some dimensions of a good school system require management at a level above individual First Nation councils. The initiative foundered on high-profile accusations by prominent First Nation leaders that Bill C-33 was a “neocolonial” intervention. Atleo resigned his position. The government withdrew the bill and the funding increase incorporated in the federal budget.11
First Nation leaders who mistrust federal or provincial intervention face a dilemma. Whatever is the extent of First Nation education rights, three institutional levels are inevitably involved in managing First Nation education: First Nation councils, provincial governments, and Indigenous Services Canada. To date, this complex three-level system has failed Indigenous students. Ottawa and most First Nation councils lack the administrative capacity to manage good schools. Expertise lies primarily in provincial education ministries. Admittedly, the priority afforded by provincial education ministries to Indigenous student success varies.
Among the six provinces with large Indigenous student populations, BC realizes above-average outcomes relative to the five others, especially in terms of high school completion among on-reserve young adults (ages 20-24). It can be attributed to several factors:
- Across Canada, most on-reserve students at the primary level attend on-reserve schools. In BC, a First Nation province-wide association acts as a quasi-school district. It exercises considerable influence with First Nation councils on management of on-reserve schools. Similar organizations in five other provinces have less influence.
- Across Canada, most First Nation on-reserve students attend a provincial high school. Over the last three decades, BC has made important innovations engaging local Indigenous leaders with formal education (Richards et al. 2008).
- Low-stake assessments of student performance in fundamental skills is an accepted tool to evaluate school systems and promote education quality. BC is the only province that identifies Indigenous student performance in provincial schools (in reading, writing, and arithmetic) in the primary grades (4 and 7) – and makes results public via annual How are we doing? reports (BC, annual).
Stephen Heyneman (2022) is a respected academic with four decades of experience in analyzing school systems in many developing countries.12 Here are his five dimensions to evaluate school systems. (In italics are comments applicable to on-reserve and provincial schools across Canada):
- Curriculum and materials: The curriculum includes the cognitive expectations for student learning at specific grades, and relevant school materials are readily available. The expectations are taught in a manner that respects relevant cultural features of the students’ communities. A violation of the first requirement is use of a uniform curriculum for Indigenous and non-Indigenous students in each province. Successful pedagogy should not set low standards for core cognitive skills (reading, math, science), but it must make major adjustments in curricula for Indigenous students relative to typical provincial students.
- Teachers: Teachers consider themselves as professionals. As a professional, their reward is not only a reasonable salary, it is the satisfaction in achieving student learning. In too many on-reserve schools, teachers have short-term contracts and few incentives to make a professional career of long-term teaching in an on-reserve school.
- Regular monitoring and evaluation: Beyond early primary grades, effective schools make use of quizzes and exams, with an understanding among students and parents that the goal is to improve learning, not criticize the student. Senior managers make use of random sample low-stake assessments of key cognitive skills, starting with reading and arithmetic. Often, in on-reserve schools, principals advance students to the next grade knowing that the students have not met grade expectations. Few reserve schools in any province undertake regular low-stake student assessments. With the exception of BC, no provincial education ministry releases public school learning outcomes from assessments of Indigenous students.
- Students: In successful schools, students generally want to learn. Parents, teachers, and community leaders play a necessary role in fostering student desire to learn. Due in part to the history of residential schools, parents, teachers, and community leaders often spend little energy in promoting the value of schooling for Indigenous children.
- Families: Families are supportive of their children’s school; parents and other guardians participate in children’s learning. Given the history of Indigenous student schools (on- and off-reserve), many parents, other adults, and siblings accord a low priority to supporting children’s learning.
In the following personal exchange, McCue emphasizes appropriate curriculum, and makes reference to problems arising from unprepared teachers, unaccountable principals, and unsupportive parents:
Conclusion
The goal of this policy brief is to emphasize that low employment rates among Indigenous communities, especially in the Prairies, are a relevant factor that explains, to some extent, high rates of “deaths of despair”.
In the short term, there may be potential for expanded government employment support for Indigenous people. In the medium term, major improvements in both on- and off-reserve school systems are necessary.
Finally, realizing significant school improvements will be expensive. Among the most promising initiatives in improving education outcomes among secondary students at high risk of dropout has been Pathways, an NGO that combines extensive tutoring and mentoring of students living in selected low-income urban neighbourhoods.13 The annual cost per student is approximately $5,000.
John Richards
A trained economist, John Richards has written extensively on social policy in Canada, primarily via the C.D. Howe Institute where he holds the Roger Phillips chair in social policy. His current social policy focus is on Aboriginal policy. He is also the co-editor of Inroads, a Canadian policy journal. Early in his career he co-wrote a book (with Larry Pratt) on the history of the resource sector (oil, coal, gas, potash, oilsands) in Alberta and Saskatchewan. A professor at Simon Fraser University’s School of Public Policy, Richards has taught and conducted research in Bangladesh over the last decade and heads a modest policy institute linked to the International University of Business Agriculture and Technology.
Endnotes
1 In preparing this manuscript, I acknowledge support from several people, in particular Pierre Fortin, Harvey McCue, and my brother Simon. Pierre Fortin and I wrote a bilingual oped on the tragedy. The French version was published in Le Devoir, the English version in the Saskatoon Star-Phoenix and Regina Leader-Post. Any errors of fact or analysis are mine.
2 A limitation of this monograph is the absence of a detailed discussion of outcomes in the northern territories, and specific outcomes of the Inuit population. The relevant homicides are included in Figure 2.
3 For a review of Fire Water see Richards (2020).
4 Among Indigenous people, 89% live in one of these six provinces and these provinces encompass 92% of all Indigenous homicide victims. A limitation of this monograph is the absence of a detailed discussion of homicide outcomes in the Atlantic provinces and northern territories, and the specific outcomes of the Inuit population. The relevant homicide outcomes are however included in Figure 2. In each of the Atlantic provinces and territories, annual Indigenous homicide counts are all below 10; hence, annual variance is very large relative to mean.
5 First Nation employment rates are substantially lower than those among Métis. To the extent that a “deaths of despair” dynamic is a partial explanation for homicide, the First Nation employment rates may be more relevant than Métis rates.
6 The homicide victim rates in the territories are high, but counts are low, with high variance. Cumulative homicide victim counts, 2017-2021, are respectively 11, 14, and 25 in YU, NT, and NU. The cohorts ages 20-24 in each territory are below 3,000.
Selected statistics, northern territories (percent)
| YU | NT | NU | |
| Indigenous employment rate, 2021 | 60.5 | 47.9 | 35.3 |
| Indigenous homicide rate (per 100,000), average 2017-2021 | 23.6 | 12.3 | 15.0 |
| Indigenous high school completion rate, ages 20-24. 2021 | 89.8 | 76.8 | 44.5 |
Sources: Statistics Canada 2022, Table 35-10-0156-01, Table 98-10-0451-01, Table 98-10-0420-01
7 Of the 827 Indigenous perpetrators accused of homicide, 81% are male.
8 The Indigenous suicide rates (per 100,000 at risk, between 2011 and 2016) in Manitoba, Saskatchewan, and Alberta were respectively 37, 36, 28; the rates in all other provinces were below 21.
9 Given high correlation among the factors, identifying the contribution of each is not possible. For example, higher education increases probability of employment, which improves family income. If we consider socio-economic factors most subject to policy intervention, employment and education stand out.
10 For comparable data from the 2016 census, see Richards (2018).
11 I acknowledge that Harvey McCue and I participated in the Atleo/Strahl project. In conjunction with Gordon Martell (former superintendent of the Saskatoon Catholic school system, currently at University of Saskatchewan) and Michael Mendelson (senior deputy minister in several provincial governments), we wrote the major consulting report leading to Bill C-33. See Anderson and Richards (2016) for an interpretation of the project.
12 Heyneman (2022) has summarized his five dimensions for creating successful schools in the context of evaluation of primary education in a large pilot project among low-income Bangladeshi families.
13 Pathways organized its original project in a public housing project in Toronto. The evaluation of Pathways by Oreopoulus and colleagues (2015) addressed the self-selection bias in such projects – the difficulty in measuring whether student success is due to the Pathways initiative or to supportive families whose children are likely to graduate with or without special support.
References
Anderson, B., J. Richards. 2016. Students in Jeopardy: An Agenda for Band-Operated Schools. Commentary 444. Toronto: C.D. Howe Institute.
Aragon, F. 2015. The Effect of First Nations Modern Treaties on Local Income. E-brief 218. Toronto: C.D. Howe Institute.
British Columbia. annual. How are we doing? Ministry of Education.
Canada. 1996. People to People, Nation to Nation: Highlights from the Report of the Royal Commission on Aboriginal Peoples. Ottawa: Royal Commission on Aboriginal Peoples.
Canada. 2017. Breaking Point: The Suicide Crisis in Indigenous Communities. Parliament of Canada. Standing Committee of Indigenous and Northern Affairs.
Canada. 2019. National Inquiry into Missing and Murdered Indigenous Women and Girls, Reclaiming Power and Place: The Final Report of the National Inquiry into Missing and Murdered Indigenous Women and Girls, Vol.1a.
Case, A., A. Deaton. 2020. Deaths of Despair and the Future of Capitalism. Princeton University Press.
Chandler, M., C. Lalonde. 1998. Cultural Continuity as a Hedge against Suicide in Canada’s First Nations. Transcultural Psychiatry 35 (2): 191–219.
Environics Institute. 2010. Urban Aboriginal Peoples Study. Environics Institute. https://www.uaps.ca/knowledge/reports/
Feir, D., J. Thomas. 2019. Introduction of Formal Child Care Services in Inuit Communities. Canadian Public Policy 45(4).
Flanagan, T. 2019. Wealth of First Nations. Fraser Institute.
Heyneman, S. 2022. Chapter 7, Why Bridge Works. in S. Heyneman, S. Islam. S., J. Richards. Bridge school evaluation: final report. Accessed 20221225 at https://www.brac.net/program/education/
Johnson, H. 2016. Firewater: How Alcohol is Killing My People (and Yours). University of Regina Press.
Kumar, M., M. Tjepkema. 2019. Suicide among First Nations people, Métis and Inuit (2011-2016): Findings from the 2011 Canadian Census Health and Environment Cohort. Accessed 202000725 at https://www150.statcan.gc.ca/n1/pub/99-011-x/99-011-x2019001-eng.htm
McCue, H. [Waubageshig]. 2016. First Nations Elementary-Secondary Education: A National Dilemma. Verbatim. Toronto: C.D. Howe Institute.
_______ 2022. personal communication.
National Inquiry into Missing and Murdered Indigenous Women and Girls. 2019. Reclaiming Power and Place: The Final Report.
Oreopoulos, P. R. Brown, A. Lavecchia. 2015. Evaluating Student Performance in Pathways to Education. E-brief 203. Toronto: C.D. Howe Institute.
Organisation for Economic Cooperation and Development (OECD). 2019. Education at a Glance, 2018.
Perrault, S. 2022. Victimization of First Nations people, Métis, and Inuit in Canada. Canadian Centre for Justice and Community Safety Statistics. Accessed 20221213 at https://www150.statcan.gc.ca/n1/pub/85-002-x/2022001/article/00012-eng.htm#r48
Richards, J., J. Hove, K. Afolabi. 2008. Understanding the Aboriginal / non-Aboriginal Gap in Student
Performance: Lessons from British Columbia. Commentary 276. Toronto: C.D. Howe Institute.
_______ 2018. Pursuing Reconciliation: The Case for an Urban Off-Reserve Agenda. Commentary 526. Toronto: C.D. Howe Institute.
_______ 2020. Is Alcoholism First Nations’ Key Dysfunction? Inroads 47 (summer/fall). Accessed 20230104 at https://inroadsjournal.ca/is-alcoholism-first-nations-key-dysfunction/
Statistics Canada. 2022. Number, percentage and rate of homicide victims, by gender and Indigenous identity. Table 35-10-0156-01.
Statistics Canada. 2022. Labour force status by highest level of education, Indigenous identity, age and gender: Canada, provinces and territories, census metropolitan areas and census agglomerations with parts. Table 98-10-0451-01
Statistics Canada. 2022. Number and rate of victims of solved homicides, by gender, Indigenous identity and type of accused-victim relationship. Table 35-10-0119-01.
Statistics Canada. 2022. Indigenous identity by Registered or Treaty Indian status: Canada, provinces and territories, census metropolitan areas and census agglomerations with parts. Table 98-10-0265-01
Statistics Canada. 2022. High school completion by Indigenous identity, Indigenous geography and labour force status: Canada, provinces and territories. Table 98-10-0420-01
Wilson, W.J. 1996. When Work Disappears: The World of the New Urban Poor. New York: Vintage.