
Is the federal public service too big? An analysis of public service employment trends: 2015-24
Prime Minister Mark Carney has indicated his government will undertake a spending review as part of a goal to reduce the federal deficit. It will include whether the federal public service meets the needs of Canadians. This Policy Paper explores the growth of the public service during the last 10 years.
By Peter Nicholson, Former chief policy advisor Office of the Prime Minister of Canada; Special Advisor to the Secretary-General of the OECD; former president of the Council of Canadian AcademiesIntroduction
Download the JSGS Policy Paper
Download the Discussions Questions
Prime Minister Carney has promised to transform the Government of Canada, acknowledging that “the federal government has been spending too much” and declaring that “we need to be efficient and effective in all that we spend, while empowering a world-class, tech-enabled public service.” To that end, the Prime Minister is launching “a comprehensive review of government spending to increase the government’s productivity” adding that “as part of our review we will ensure that the size of the federal public service meets the needs of Canadians.” Implicit in the Prime Minister’s undertaking is a belief that the public service has become too big, although he has committed to “capping, not cutting, public service employment.”
The purpose of this paper is to provide context for the Prime Minister’s objective to transform government, in part by ensuring that the size of the federal public service meets the needs of Canadians. Since Justin Trudeau became Prime Minister in 2015 more than 110,000 (net) new employees have been added to the public service, an increase of 43% in nine years, bringing total headcount to just under 368,000 as of 2024.1 While these figures raise headline questions regarding the size of the public service, they need to be interpreted in light of the policy objectives of the government of the day as well as factors affecting the efficiency with which the government’s agenda is implemented. The appropriate size of the federal public service can only be assessed in this context. To that end, this paper addresses the following questions:
- What factors have been driving the rapid growth of the public service since 2015?
- Is the federal public service too big and, if so, according to what criteria?
Growth of the federal public service in context
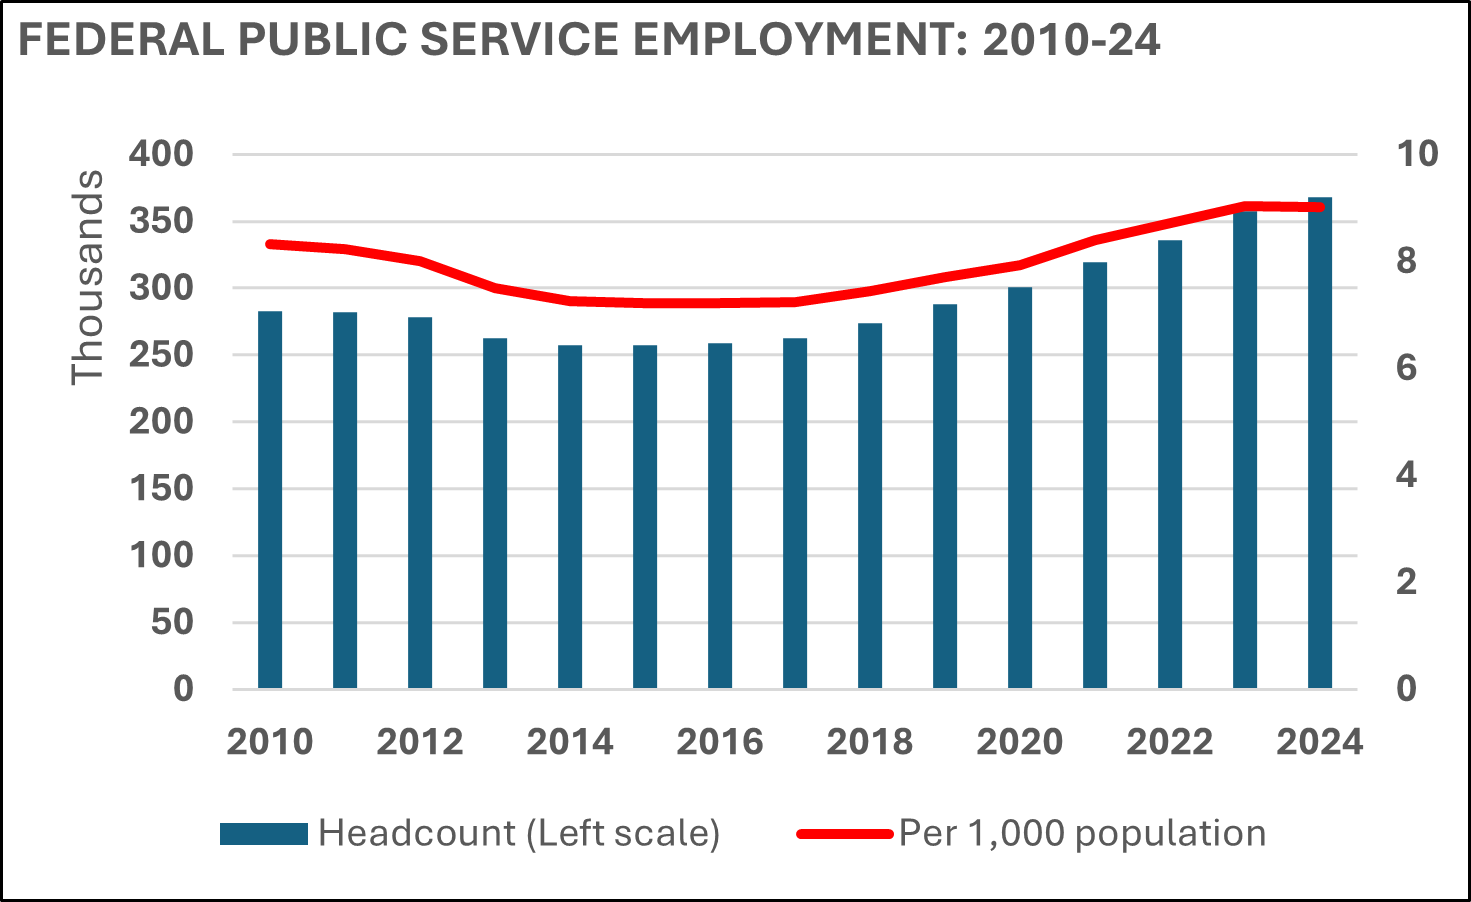
In 1993 the federal public service numbered 240,500. By 1998, following the fiscal retrenchment initiated in the 1995 budget, headcount had fallen 22% to 187,000. But by the beginning of the Harper government in 2006, employment had recovered to 250,000 and continued to increase to 283,000 in 2010. By the end of the Harper regime in 2015, following a period of relative austerity, employment had declined by 26,000 (9.2%) to 257,000. But by March 31, 2024, it had rebounded strongly to 367,772.1 (See table at the end of the paper for headcount by department: 2015-24.)
Can the recent growth be considered excessive? Or did the Trudeau government simply restore public service strength from an unsustainably depleted level at the end of the Harper regime? To put these numbers in context: between 2015 and 2024, while the federal public service grew 43%, Canada’s population increased by less than 15% implying that the number of federal public servants per 1,000 population increased from 7.2 to 9.0. The 43% growth of the federal public service significantly outpaced: the 18.5% (real) growth of the economy; the 15.5% growth of total employment; and the 25.5% growth of employment in the entire public sector, comprising all orders of government.
There is no reason to expect the growth of the civil service to match, much less exceed, population growth. Other things being equal, we would hope that increased productivity—e.g., through investment in information technology, better work processes, and management training—would bring public service growth below that of the population, particularly as so much specialized and urgent work is being outsourced to consultants. Clearly, the robust public service growth over the last nine years calls out for explanation and justification.
Principal factors driving public service growth
The 43% growth since 2015 appears due to some combination of the following four factors.
- The ambition and philosophy of the Trudeau government: The government came into office at a time when the neoliberal paradigm—holding that “markets know best”—was being widely questioned in the western democracies in the face of growing income inequality and the severe recession of 2008-09. It was seen as time to bring government back, and particularly the social agenda of government. In the Trudeau government’s case this coincided with a major cultural revolution—the Diversity, Equity, and Inclusion movement—which in Canada has been amplified by an historic commitment to Indigenous reconciliation. Every federal department and agency has committed to promoting DEI and reconciliation in hiring practices and human resources management. The combined effect of all the foregoing trends put strong upward pressure on staffing to accom- modate the new priorities.
- The COVID pandemic: This external shock—analogous in many ways to a declaration of war—required a large and rapid mobilization of government effort to implement extraordinary financial assistance, new public health capacity, extra border security, and many other adaptations to the unprecedented Between FY 2018-19 and 2020-21 federal program spending increased by $301 billion (93%). Partly to cope, public service headcount increased by 17% between 2018 and 2021. While program spending had come down 24% by FY 2023-24, the size of the public service has continued to grow—up 15% between 2021 and 2024 for reasons that will be addressed later.
- High-profile service disruption/degradation: Any significant degradation of critical public-facing services creates a strong political incentive to fix the problem, pronto—e.g., the problems in border services and passport issuance as travel rebounded after the pandemic. This means hiring people, often temporarily. But while occasional service fiascos attract a lot of media attention, they appear to be relatively small contributors to overall headcount growth. The big drivers of staff growth are associated with the introduction or expansion of programs that require complex eligibility assessment and other labour- intensive administrative features.
- Political and bureaucratic incentives: In a letter to the Clerk of the Privy Council in late 2023, the outgoing Chief Infor- mation Officer, Catherine Luelo, observed that departments “have not met an idea they don’t like,” and are always creat- ing new standalone programs—e.g., to implement about 700 commitments in ministers’ mandate letters.2 Meanwhile, the incentives to kill existing programs are much weaker. Obviously, every program develops a constituency of beneficiaries, including the bureaucrats who manage the program and even the external consultants who are called on periodically to evaluate it! Thus there is an inbuilt tendency for the program portfolio, and its public service cadre, to grow cumulatively and become more and more complex and fragmented. Moreover, a belief in the mystical power of information technology encourages politicians to call for programs whose design and complex eligibility features put increasing pressure on stressed legacy IT systems and require new hires, and a growing army of consultants, to fill the gaps. More generally, the labour relations environment in the heavily unionized public service, and the quasi-tenured position of more senior members, also serve to promote cumulative headcount growth—i.e., easier to hire than to fire.
Running counter to these growth drivers are two principal factors that constrain the other- wise untrammeled expansion of the public service.
- Fiscal discipline: Because there is always resistance to taxes, the fiscal constraint on public service headcount is potentially pow- The Trudeau government was fortunate that extremely low interest rates (prior to the recent inflation) and a moder- ate ratio of federal debt to GDP, permitted the government to run relatively large deficits without generating much concern in either financial markets or the general public. Consequent- ly, there was relatively little fiscal constraint on public service growth until recently.
- Productivity—doing more with less: If the government is able to provide its services more efficiently it can fulfill its various missions with fewer public servants than would otherwise be necessary. Growing labour productivity (output per employee) can be achieved in both the private and public sectors through investment in technology and capital equipment; better management practices; creative problem-solving; and through recruitment and training of motivated people. Unfortunately, productivity of the public service is inherently difficult to measure because the value of its “output” is rarely determined in the mar- ket of dollars and cents, or in any readily measurable amount other than program spending, which is far too blunt a metric. That’s why the incentive to improve productivity must come from political leadership that transmits the mission to senior bureaucrats and on down through the ranks. The problem is that the motivation may be weak in view of the relatively low political profile of the public service and the risk of high-profile screw-ups when new (potentially) productivity-enhancing technology is introduced.
Both the Harper and Trudeau governments stated a commitment to more efficient delivery of both internal and external services. For example, the headcount of Shared Services Canada—the government’s internal IT services organization—has grown rapidly as has spending on IT out-sourcing, although sometimes with disastrous consequences—e.g., Phoenix, ArriveCan. More effort is nevertheless required including to increase the professional competence of in- ternal IT hires, admittedly a challenge given various bureaucratic constraints, particularly regarding compensation.
In view of the obvious importance of attracting, training, and retain- ing top-notch people, it is odd that the two agencies ostensibly responsible internally for management training (Canada School of Public Service), and for quality recruitment and career development (Public Service Commission)4 have languished, at least in terms of staff complement and budget.3
Assessing whether the federal public service is too big
The answer is partly related to one’s view of the role of government—do we want government and the public service to do more or to do less? Nevertheless, looking at the growth of headcount since 2015 there are some objective reasons to suspect that the size of the public service is now greater than needed to implement the policy and program objectives of the Trudeau government.
- The fiscal constraint on the growth of the public service was of little concern during the period of exceptionally low interest rates on public
- Headcount continued to increase strongly in the aftermath of the pandemic build-up—increasing 1% in 2022 and 6.3% in 2023. (But as explained later, some of this growth was needed to clean up effects of COVID spending, and is planned to be temporary.)
- By 2024, the number of federal public servants per 1,000 popula- tion had reached the highest ratio (9.0) in at least the past 40 years during which governments of various ideological stripes have held
The foregoing bullet points provide circumstantial evidence that the federal public service has grown by more than necessary to deliver the government’s overall program. But the more fundamental question is whether the productivity of the public service—average output per employee—is meeting reasonable benchmarks.
The challenge of increasing government productivity
The Harper government sought to increase productivity by cutting headcount in the expectation that this would motivate innovation in work practices sufficient to maintain service levels. Unfortunately, for the most part, this didn’t happen. Instead, the result was generally reduced program integrity—e.g., a significant rise in immigration processing backlogs—which required headcount growth, early in the Trudeau government, to correct.
The onset of COVID, and the associated spike in program spending in 2019-2021, caused a dramatic increase in apparent public service productivity. The COVID-emergency payments were made largely with existing staff and procedures, causing spending per employee to peak. But in the aftermath, very large numbers of new employees had to be hired to clean up distortions created by the COVID spending measures—e.g., to determine EI entitlements in the context of CERB payments. Thus as spending plummeted post-COVID, headcount actually increased causing “productivity”—crudely measured as total program spending per employee—to crater.
While it is likely that political leadership has accorded too little priority to increasing the efficiency of government operations—doing the same or more with less—we may still ask:
(i) Was the Trudeau era growth in headcount due primarily to a lack of adequate bureaucratic control, bred of fiscal complacency? or
(ii) Was the growth driven largely by the government’s adoption of overly complex rules regarding program implementation, all in the context of inadequate technological systems?
If the answer to either question is “Yes” then we can conclude that the public service is too big—i.e., it is bigger than necessary to deliver what the government of the day seeks to accomplish. But the implications for solution are quite different. The remedy for (i) is the traditional nostrum of finance ministries everywhere—conduct expenditure and program reviews, identify the fat and activities of low priority, and wield the fiscal scalpel (or the chainsaw). That was the Harper government’s approach but the cuts were not sustainable because the anticipated productivity gains did not materialize.
In Trudeau’s case, question (ii) appears to be the more relevant, although fiscal complacency was certainly in the mix as well. The Trudeau government increased spending dramatically, quite apart from COVID, in several social policy domains. Most of these programs came with elaborate qualification criteria and were therefore labour-intensive to implement. As the examples in the text box (below) illustrate, the government’s particular spending and regulatory choices, which had a heavy bias to those that are labour-intensive, have been major drivers of the rapid headcount growth.
How Program Design Complexity Increases Staffing Requirements(The following is based on an interview with a senior official with direct knowledge of the issues)Canada has probably the most complex rule sets in the world that govern the delivery of transfers to individuals—famously around EI. Here is just one example. If you are laid off, you cannot collect EI during any period you are receiving severance pay from your company. Although this sounds straightforward, it turns out there are some 130 types of payments individuals might receive upon departing a company. You are allowed to receive most of these while still eligible for EI. The catch is that most companies don’t track the precise type. The EI system requires a human to call the company to identify the precise type of payment. Several hundred (full-time-equivalent) employees are occupied with the task. But when the CERB was introduced, the surge in EI applicants made it infeasible to make all the calls to determine eligibility. So the rule was temporarily suspended and claims were processed in hours, not weeks. But when the crisis ended, the rule was reinstated on the fiscally-motivated ground that EI payments had to be administered in strict adherence to the severance eligibility rule despite the degradation of service and increase of headcount this implied. The rules around immigration provide many other instances of extreme complexity. For example, there are five separate refugee systems with different rules for different groups—Ukrainians, Afghanis, Syrians, etc. The rules are so complex that there is no option but to deploy significant human resources to manage. The government made the rules in multiple areas extremely complex and has done so with full awareness of the implications for the added staffing requirements. |
To implement the government’s political and legislative agenda as efficiently as possible involves, as a practical matter, some combination of (a) simplifying program criteria, eligibility rules, and internal compliance procedures, and (b) becoming more sophisticated and proficient in the use of technology to automate delivery processes. Solution component (a) will often involve a trade-off between requiring complex eligibility criteria in order to tightly target spending versus simpler criteria that are cheaper to implement but result in some “wasted” spending beyond the target purpose. The main way to mitigate the trade-off—i.e., to have tightly-targeted programs that can be administered without excessive headcount requirements—is to invest heavily in sophisticated information technology and in hiring and training for its efficient use. Nevertheless, as the EI example in the text box illustrates, some rules are impossible to automate even with state-of-the-art technology so a trade-off is sometimes unavoidable. We may hope that AI will eventually permit such trade-offs to be minimized or even eliminated.
There are other situations where the problem could be avoided altogether. For example, when the government was deciding how to deliver its new dental benefits program it could have chosen to delegate the back-office processes to the Provinces that already had systems in place to handle the benefit delivery at low incremental cost. But the government chose not to, and added to its own headcount and cost instead.
Finally; multiple financial tracking and reporting systems, usually in response to some boondoggle, appear to be significant generators of head count. Redundant, overbearing compliance mechanisms, ostensibly to ensure taxpayers’ money is being spent as intended, end up imposing significant (if unquantified) costs on both the users and deliverers of programs. Because accountability imposes costs as well as benefits, attention is needed to ensure the latter exceeds the former.
Bringing technology to the rescue
The fundamental solution to lagging productivity—and to right-sizing the public service—is to become more proficient in the use of technology to automate program delivery processes. To that end Prime Minister Carney has said his government will “leverage technology to improve the automation of routine tasks and inquiries from the public and reduce the need for additional hiring…and will consider where AI can be leveraged to enhance productivity in government.”
Clearly, this is the right sentiment, but easier said than done. Experience has shown that the introduction of information technology in large public bureaucracies is a fraught process where failures are expensive and politically embarrassing. So, there is an incentive to try to play it safe and hope that legacy systems can hold up. But the answer is not to shy away, but rather to double down on the commitment to efficiency and to invest in developing far greater internal expertise to guide and complement the still necessary use of external consultants.
Successive governments have talked a good game, but there is a very long way to go. As documented by the Auditor General in a 2023 Report on Modernizing Information Technology Systems: “It has been more than 24 years since the government first identified aging systems as a significant issue and…still does not have a strategy to drive modernization. Only 38% of the government’s approximately 7,500 information technology applications were considered healthy…about one-third out of the 1,480 applications designated as mission-critical…were still considered in poor health…Many aging systems are currently being maintained on old and outdated infrastructure, which is costly, resource intensive, and unsustainable.”
Among the many factors that have contributed to this sorry state of affairs, Michael Wernick, a former Clerk of the Privy Council, observed that the government has never resolved how technology should be managed. Should it be a single service with common standards, interoperability and cybersecurity? Or would it better function as a loose federation of 300 departments and agencies where deputy heads and managers exercise autonomy?
It is well beyond the scope of this paper to suggest what specifically the government needs to do to finally resolve its decades-long digital technology conundrum, a challenge that can only become more urgent with the emergence of powerful artificial intelligence. Within the new Carney government that responsibility will presumably fall to Joel Lightbound, as Minister of Government Transformation with the collaboration of Evan Solomon, the inaugural Minister of Artificial Intelligence and Digital Innovation. Fortunately, there will be no shortage of advice from those with long experience in the way government works, as well as those with deep understanding of what is required to implement digital technology in large organizations.
Conclusion
Is the federal public service too big? When considering the question, we should set aside opinions related to the role of government in society—should it play a bigger or smaller role? That is a political decision, although with obvious implications for the size of the public service. But political ideology aside, there remains the technocratic challenge of achieving the program of the government of the day as efficiently as possible. To the extent that headcount exceeds what is needed to accomplish the task, one can conclude that the public service is too big.
There are two separate dimensions, which I would label Tactical and Strategic, regarding the right size of the public service:
- The Tactical dimension: Given the program design and technology implementation already in place, are there more public servants than reasonably needed to execute the government’s program?
- The Strategic dimension: Have the government’s choices regarding program design and technology implementation necessitated a larger public service than would otherwise be needed to execute the government’s program?
Along the Tactical dimension, there is an inherent tendency of large public bureaucracies to overstaff, subject to countervailing fiscal pressure. That pressure, until very recently, has not been a potent constraint so it would be expected that headcount has inflated cumulatively. On top of that, the COVID emergency likely led to some hiring that is now being unwound more slowly than strictly necessary.
Along the Strategic dimension, it is clear that the government’s decisions—e.g., requiring increasingly complex program criteria and eligibility rules, and the failure to upgrade or even maintain information technology—have required a lot of hiring just to cope. The findings of the Auditor General regarding the state of the government’s digital capacity and the experience of senior managers provide the compelling evidence.
It's not possible to quantify with any precision the magnitude of the Tactical and Strategic effects on the size of the public service. Nevertheless, I would conclude that the federal public service has in fact become too big based primarily on the following evidence:
- The number of federal public servants per 1,000 population has climbed steadily to the highest level in at least 40 years.
- For most of the period since 2015 (until COVID), thanks to sustained low interest rates, there was relatively little fiscal motivation to counter the inherent bureaucratic tendency to increase headcount cumulatively.
- Government programs have become subject to increasingly complex rules but without adequate investment in the information technology needed for efficient administration. Headcount has had to be increased to plug the gap.
It is therefore both welcome and timely that Prime Minister Carney has to comprehensively review federal spending in order to increase the government’s productivity, and to ensure that the size of the federal public service meets the needs of Canadians. Our economy is in the throes of a productivity slump bordering on crisis. Every sector is being challenged to up its game. The federal government can be no exception.
Endnotes
[1] On May 23, 2025, the Treasury Board announced that the population of the federal public service was 357,965 at March 31, 2025, a decrease of 9,807 or 65% from a year earlier, marking the first decline of headcount in 10 years. The largest reductions were in the Canada Revenue Agency (6,656 or 11.3%) and Immigration, Refugees and Citizenship (1,944 or 14.9%).
[2] The source for all employment data in this paper is the Treasury Board Secretariat employment database. Here, the “public service” consists of employees of federal departments and agencies listed in the various schedules of the Financial Administration Act. The data exclude political staff, (non-civilian) members of the Canadian Forces and RCMP, as well as employees of more than 30 Crown Corporations such as Canada Post, the CBC, the Bank of Canada, etc. The detailed employment data cover the period from March 31, 2010 through March 31, 2024—reported here on a calendar-year basis—and are broken down by departments and agencies. The referenced employment numbers are lower than those encompassed in the Personal Expenditure Analysis of the Parliamentary Budget Office which includes the non-civilian members of the Canadian Forces and RCMP. The PBO headcount in 2021-22 (413,000) is about 80,000 greater than the number in the Treasury Board Secretariat’s database.
[3] Prime Minister Carney, in a departure from Trudeau’s practice, has provided shorter mandate letters (not publicly released) focused on the government’s top overall priorities.
[4] The headcount of the Public Service Commission increased 21% to 892 between 2015 and 2024 while staffing at the School of Public Service grew by only 5% to 679. This is to be compared with growth of 43% for the entire public service.
[5] Prime Minister Carney has said that the government’s review of government spending will include “significantly reducing reliance on external consultants, while improving the capacity of the public service to hire expertise in-house.”
SOURCE: TREASURY BOARD SECRETARIAT. ALLOCATION OF DEPARTMENTS/AGENCIES TO FUNCTIONAL AREAS WAS DONE BY THE AUTHOR. SOME SMALLER UNITS HAVE BEEN OMITTED.
|
|||||||||||||||||||||||||||||||||||||||||||||||||||||||||||||||||||||||||||||||||||||||||||||||||||||||||||||||||||||||||||||||||||||||||||||||||||||||||||||||||||||||||||||||||||||||||||||||||||||||||||||||||||||||||||||||||||||||||||||||||||||||||||||||||||||||||||||||||||||||||||||||||||||||||||||||||||||||||||||||||||||||||||||||||||||||||||||||||||||||||||||||||||||||||||||||||||||||||||||||||||||||||||||||||||||||||||||||||||||||||||||||||||||||||||||||||||||||||||||||||||||||||||||||||||||||||||||||||||||||||||||||||||||||||||||||||||||||||||||||||||||||||||||||||||||||||||||||||||||||||||||||||||||||||||||||||||||||||||||||||||||||||||||||||||||||||||||||||||||||||||||||||||||||||||||||||||||||||||||||||||||||||||||||||||||||||||||||||||||||||||||||||||||||||||||||||||||||||||||||||||||||||||||||||||||||||||||||||||||||||||||||||||||||||||||||||||||||||||||||||||||||||||||||||||||||||||||||||||||||||||||||||||||||||||||||||||||||||||||||||||||||||||||||||||||||||||||||||||||||
Peter Nicholson

Peter Nicholson has served in numerous posts in government, business, and higher education. His public service career included positions as Clifford Clark Visiting Economist in Finance Canada; Deputy Chief of Staff, Policy in the Office of the Prime Minister; and Special Advisor to the Secretary- general of the OECD. Dr. Nicholson’s business career included senior executive positions with Scotiabank and BCE Inc. He retired in 2010 as founding president of the Council of Canadian Academies, an organization that conducts expert panel studies of scientific issues related to public policy. He is currently the Chair of the Board of the Canadian Climate Institute. Dr. Nicholson is a Member of the Order of Canada and the Order of Nova Scotia and is the recipient of six honorary degrees.
JSGS Policy Brief continues below advertisement.