

Bound by the laws of growth: A Long-Term Global Perspective on Canada's Economic Performance
We might wonder if the economic trajectories of nations are determined by “laws of growth”, much as the law of gravity determines the trajectories of stars and planets. Clearly there are no laws of economic growth that approach the precision, universality, and permanence of the laws of physics. But if we stand back and observe the economic growth paths of nations from a sufficiently long-term, global perspective, certain significant regularities emerge. The purpose of this essay is to elaborate this claim as well as some of its implications for Canada’s economic performance looking forward.
By By Peter Nicholson, Former Deputy Chief of Staff for Policy, Office of the Prime Minister of Canada; Former Inaugural President, Council of Canadian AcademiesIntroduction
Download the JSGS Policy Paper
Download the Discussion Questions
We might wonder if the economic trajectories of nations are determined by “laws of growth”, much as the law of gravity determines the trajectories of stars and planets. Clearly there are no laws of economic growth that approach the precision, universality, and permanence of the laws of physics1. But if we stand back and observe the economic growth paths of nations from a sufficiently long-term, global perspective, certain significant regularities emerge. The purpose of this essay is to elaborate this claim as well as some of its implications for Canada’s economic performance looking forward.
Economic performance is conventionally measured by the rate of growth of gross domestic product (GDP) per person. Although GDP is not a measure of quality of life, it is correlated with many indicators of well-being and human flourishing. The growth rate of GDP per person has thus become the principal indicator of “progress”, despite negative consequences that can accompany the growth process.
A remarkable feature of the GDP growth rates of the economically advanced countries is that the rates follow a common path, with countries in the group growing on average neither faster nor slower than their fellow travellers. This commonality of per capita GDP growth rates within the leading group of countries is well-known to students of long-term economic growth, but has attracted less attention than warranted within policy and media circles2.
|
Thesis in a Nutshell
|
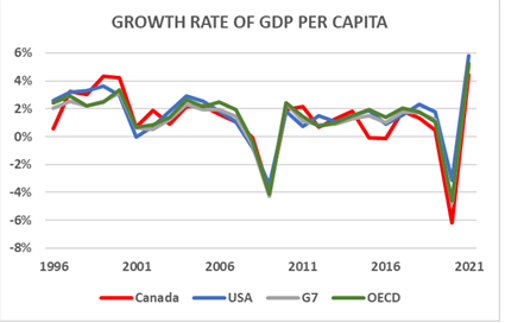
The Growth Rate Peloton
As illustrated in the chart, the GDP growth rates of the US, Canada, the G-7, and the OECD countries as a group are remarkably tightly correlated, with deviations reflecting country-specific factors that tend to be of relatively short duration—e.g., the effect of the fall, rise, and fall of oil prices (2014-19) clearly visible in Canada’s growth rate.
 Source: OECD
The economically advanced countries all progress at roughly the same speed, like the tightly bunched group of riders—called the peloton—at the head of a bicycle race. We will refer metaphorically to countries in this leading group as belonging to the “growth rate peloton”. The member countries may be defined as those with sustained GDP per capita at least 70% that of the US. This includes the G-7; most western European countries; Australia, New Zealand, South Korea, and a few others. Some oil-rich states would qualify according to per capita GDP but have yet to establish economies with the diversity to remain resilient in the event of a significant reduction of resource revenue.
What explains this convergence of GDP growth rates?
It is the result of the extensive sharing of innovation, technology, and general know-how among the members of the peloton. The sharing occurs by way of trade, direct foreign investment, business consultancies, academic exchange, the movement of people with relevant knowledge, as well as the many formal and informal channels by which experience is exchanged, a process now made more efficient thanks to digital communications. There is a pervasive web of intra- and inter-national interactions that rapidly transmit the factors that sustain a high and growing level of economic output. This flow has both tangible and intangible manifestations—e.g., advanced machinery and intellectual property—that translate via the diffusion of innovations and best practices into growth of labour productivity (GDP per hour worked) and thereby into economic growth and other measures that correlate with human welfare.
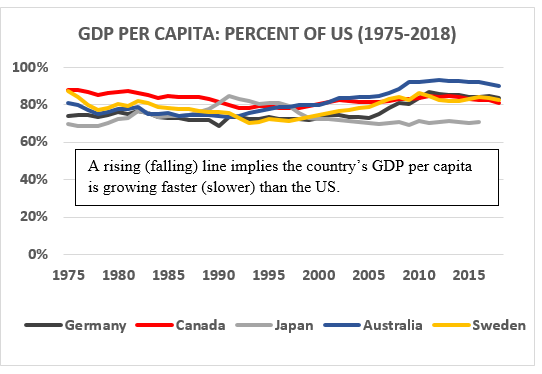
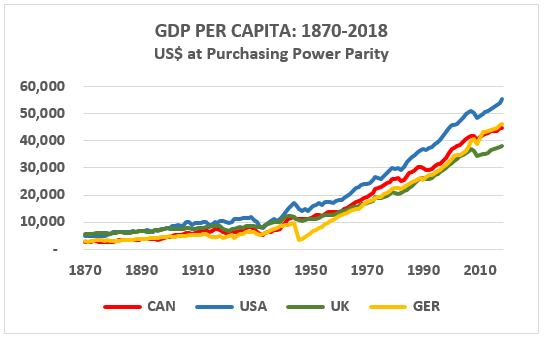
Although GDP growth rates converge within the peloton, the dollar levels of GDP per capita generally do not. The US, for example, has led the pack for more than a century with per capita GDP that remains about 20-25% above most of the rest of its peer group. The US maintains its dominant position by continuing to be an innovation leader across a broad spectrum of sectors. It sets the pace of the peloton but cannot halt the diffusion of innovation to other economies. With few and relatively minor exceptions, the other members of the peloton have not been able to leapfrog the broad-based first-mover position of the US. They are able to keep up in relative terms, but not overtake. That is because it takes time for innovation to diffuse from the leader(s) and be adopted and extensively utilized by others in the peloton. In that interval, the leader continues to innovate, thus maintaining its position. Of course, the persistence of US economic leadership is not a law of nature. The United States itself overtook Britain in the early 20th century and replaced it as the global economic hegemon.
 Source: Maddison Historical Statistics Project
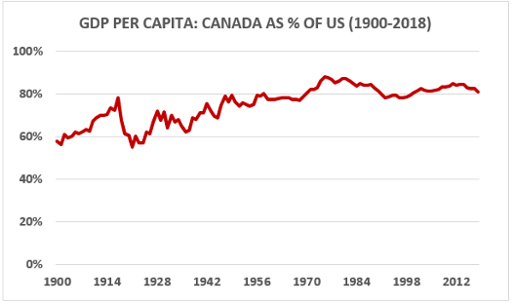
A country, or region, may for a variety of reasons start out well behind the growth peloton but then begin a sustained growth drive that brings it into the peloton and onto a relatively stable long-term growth path. During the catch-up phase, the country will grow faster than those in the peloton, but eventually its growth rate converges to that of the leader and the rest of the group. For example, the growth rate of Canada’s per capita GDP exceeded that of the US, on average but with large ups and downs, from about 1900 through the end of WW II, bringing the level of GDP per capita from about 60% of the US benchmark to 80% by 1947 where it has remained approximately the same since—i.e., in terms of GDP per capita, Canada has grown on average at the same rate as the US for the past 75 years. Because the business and political media focus almost entirely on the short term, where fluctuations dominate, there is little awareness of the remarkable long-term stability evident in the chart above. (Several examples illustrating the variety of relative growth trajectories of different countries are presented in the Annex.)
The Institutional Foundations of Long-term Economic Growth
The cross-nation history of economic growth (see Annex) demonstrates that to achieve and then sustain performance comparable to that of the global leaders requires the support of solid institutions that:
- Enhance the capabilities of every person and thus promote equality of opportunity—including universal education of high quality, and a basic standard of welfare. Education, and the enhancement of human capital more generally, is clearly essential for a high-performing economy. Assuring a basic standard of welfare is needed not only to promote universal opportunity but also to provide the sense of fairness that creates common purpose.
- Ensure against arbitrary actions that amplify economic risk; including institutions that uphold the rule of law, provide for due process, maintain security, and protect property rights. Entrepreneurial initiative, innovation, and investment are inherently risky and are more likely to be undertaken in environments where the rules of the game are seen to be fair, and uncertainty regarding their consistent application is minimized.
- Provide competent, non-corrupt government. Economic performance depends critically on provision of high quality public infrastructure; competent macroeconomic management including a well-designed taxation system, an independent central bank, and well-regulated financial institutions; a regulatory environment that fosters competition and provides ample scope for initiative; and the policy-making capabilities to support the foregoing and the managerial competence of government to assure their implementation.
Democracy, in the Western sense, is neither necessary nor sufficient to ensure these conditions. But a robust check on the corrupting effect of absolute power—a check that is more likely to be found in democratic systems—appears to be essential for sustained economic success. The members of the growth peloton differ somewhat in the extent to which their institutions satisfy the three foregoing conditions. Western European countries have focussed particularly on the first factor; the US has placed greater emphasis on the second; while Canada has sought balance across all three. But the inter-country variance has remained within relatively tight bounds.
On the other hand, members of the peloton differ significantly in the structure of their economies and the details of their economic policies. Canada, Norway, and Australia, for example, have resource-based wealth but consistently rank relatively low on international measures of business innovation, whereas Japan, Switzerland, and South Korea regularly rank among business innovation leaders. The US economy, by virtue of resource endowment, scale and scope, has strength across the board.
 Source: Maddison Historical Statistics Project
What is remarkable is that members of the leading peloton have for well over a century maintained approximately equal rates of economic growth, at a high level of GDP per capita, despite wide swings in economic conditions and very different “industrial” structures. The implication is that there are many different country-specific recipes for sustainable economic success.
The most significant generalization is that once a country or region joins the growth peloton, and provided it maintains the previously noted three fundamental institutional ingredients for success, it is almost certain to be carried along in the “draft” of the other riders. This is enabled by the pervasive web of linkages that diffuse innovation, know-how, and technology throughout the peloton.
The point to be emphasized is that there is nothing automatic about this equilibrium. Like the riders in the bike race, you have to keep pedalling hard to stay in the peloton. But the motivation to keep pedaling hard appears to be rooted in the institutional qualities that enable a society to join the peloton in the first place. This would account for its stability. Nevertheless, complacency is never justified.
Implications for Canada Looking Forward
The persistence of the close correlation of growth rates of the leading countries raises at least the following specific questions in respect of Canada’s performance:
- How has Canada been able to maintain its place in the peloton despite weak productivity growth, particularly relative to the US, since the mid-1980s?
- Why is Canadian business a perennially mediocre performer, by peer group standards, on most measures of innovation?
- Is Canada’s “low innovation equilibrium” sustainable?
- What should be governments’ priorities to help keep Canada in the growth peloton?
Question 1: How has Canada been able to maintain its place in the peloton despite weak productivity growth relative to the US since the mid-1980s?
By definition, GDP per capita is: GDP per hour worked (labour productivity) multiplied by hours worked per capita (the employment ratio7.) The growth rate of GDP per capita is therefore equal to the growth rate of productivity plus the growth rate of the employment ratio8. In Canada’s case, as productivity growth declined relative to that of the US (falling red line in the chart), the employment ratio (blue line) increased relative to the US. Since 1995, the two factors almost precisely offset one another to keep the growth rate of Canada’s GDP per capita essentially equal to that of the US, thus maintaining the level of Canada’s per capita GDP at about 80% of the US (the dotted line, which is precisely equal to the product of the blue and red lines).
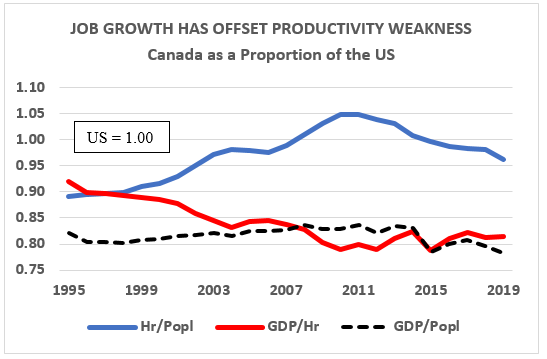 Source: Centre for the Study of Living Standards
The dynamics underlying the employment and productivity trends in the chart are complex. US productivity growth was exceptionally rapid during the 1990s as it led the world in the application of information technology (IT) to a wide range of business processes. Canadian business, on average, lagged in the IT transformation, as did most countries in the growth peloton. Meanwhile, the trend of the employment ratio reflects the product of several factors: the fraction of the population of labour force age; the labour force participation rate; the unemployment rate; and the average hours worked per job. These economic, demographic, and social factors have influenced the evolution of the employment ratio somewhat differently in Canada than in the US, resulting in much more rapid growth of the ratio in Canada from 1995 to 2010—the rising blue line. Since 2010, the change in the employment ratio has favoured the US—the falling blue line. But over the period 2010-19, Canada’s productivity growth (for the total economy) matched, or slightly exceeded that of the US, thus moderating the relative effect on per capita GDP of the relative decline of the employment ratio since 2010. The interplay between productivity and the employment ratio is very complex but intuitively there would be some tendency when labour market conditions tighten for businesses to increase their focus on improving productivity.
Of great significance for Canada is that the growth of the employment ratio is inherently limited since the number of workers obviously cannot exceed the total population. In fact, the proportion of workers to population is facing a strong headwind as Canada’s population ages. Immigration can provide a partial antidote. But ultimately, growth of GDP per capita will be largely determined by productivity growth, and productivity growth in turn depends primarily on innovation—new or better ways of doing things9.
Question 2: Why is Canadian business a perennially mediocre performer, by peer group standards, on most measures of innovation?
Canada persistently ranks behind the US, Japan, Korea, and most western European countries on the standard metrics of innovation—e.g., business R&D, investment in intellectual property products, patents, technology-intensive exports, and aggregate indices of innovativeness10. On the other hand, Canada has ranked impressively on many measures of academic research quality, benefiting from robust federal government support. This has led to decades of hand-wringing and puzzlement as to why Canadian business—on the whole, but with some notable exceptions—has not been able to, or not chosen to, translate academic research excellence into more commercial innovation.
For starters, there is almost always a wide gulf between academic research and its ultimate “commercialization”. Commercial application of leading-edge knowledge requires companies for which this is the primary focus of their business strategies. Canada has some companies in this category, but relatively fewer, and smaller, than its peers in the top tier of the innovation rankings11. Why?
It is because Canada has comparative advantage within an integrated North American economy in sectors that do not rank high on conventional measures of innovativeness—e.g., resource extraction and light processing; branch plant manufacturers that often do little R&D, relying instead on headquarters. Canadian business has nevertheless carved out a profitable role that is complementary to the US. It is not too much an oversimplification to say that Canada produces resource commodities and a range of fairly standard goods and services in exchange for “innovation” in the form advanced capital goods, technology-intensive manufactured products; sophisticated services; and the technology and know-how that come bundled with branch plants. In this respect. Canada has been uniquely fortunate to share a continent with the lead horse in the global economy for more than a century. And by virtue of excellent institutional support for economic growth—recall the three fundamental institutional traits noted earlier—Canadian business has largely been successful in absorbing, applying, and extending innovation and know-how sourced from the US and other countries in the growth peloton.
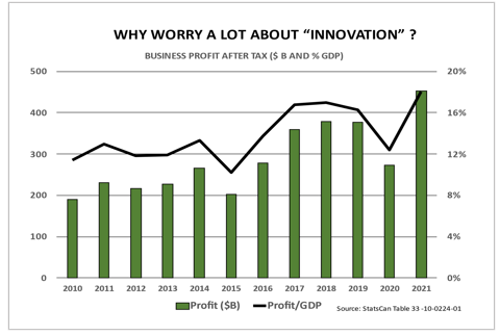
The evidence of success is two-fold: first, that Canada’s level of GDP per capita has matched or exceeded that of most G-7 and OECD countries for decades; and second that Canadian business, on average, has continued to prosper—see chart above of after-tax business profit as a generally rising share of GDP. The message in the data: Canadian business has been only as innovative as it has needed to be.
Question 3: Is Canada’s “low innovation equilibrium” sustainable?
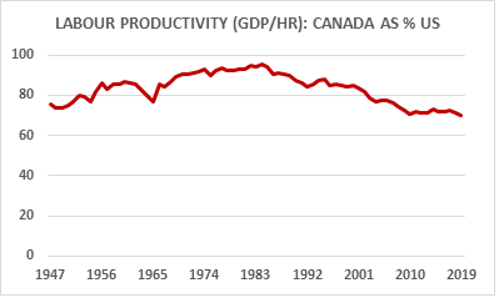
For decades, pundits and policy analysts, including this writer, have warned that Canadian business needed to become more focussed on innovation in order to prosper in an increasingly competitive and knowledge-intensive global economy. And the warning took on greater credibility and urgency as productivity in the business sector, relative to the US, declined steadily from about 95% of the US level in the mid-1980s to just 70% currently. But as noted earlier, in the economy as a whole, strong job growth largely offset weak productivity growth, and in the business sector, profitability held up well.
 Source: Centre for the Study of Living Standards
As long as economic growth keeps up with our main comparator, the US, and business profitability remains robust, there will be little incentive—either in Ottawa or in corporate board rooms—to change an economic paradigm that has served Canada well since the end of the Second World War. One might hope or expect that we should strive to do even better—e.g., close the remaining GDP gap with the US—but that would involve the effort and risk of leaving an established comfort zone. In this context, “satisficing” rather than maximizing has, on the whole, been Canada’s implicit strategy.
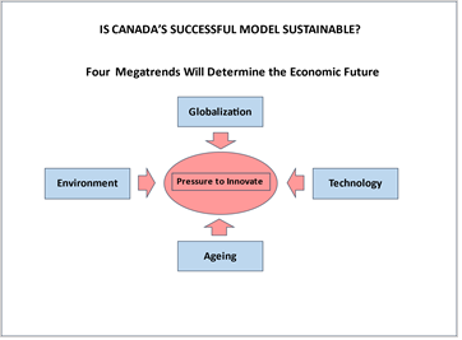
Now however there are plenty of storm signals to suggest that “this time will be different”. The challenge confronting Canada’s traditional low-innovation business strategy is magnified by four megatrends that will shape the world economy and the associated political environment for the foreseeable future: globalization, technology, environmental sustainability, and population ageing.
Globalization: The experience of the Covid pandemic, the shocking Russian aggression in Ukraine, and growing tensions with China have cast a pall over the economic globalization of the past several decades. “Friendshoring” is now being promoted to replace offshoring. Notwithstanding the case to shorten and secure certain supply chains, the fundamental economic logic of globalization remains intact for the longer term. Although the United States is bound to remain Canada’s principal economic partner, the primary locus of global growth will continue to move toward Asia. Consequently, long-term economic opportunity is shifting from a market (North America) where Canada has enjoyed unique advantages of geography, language, and business culture to markets where it has little established position, except as a commodity supplier. Meanwhile, Canada’s outsized dependence on the US market, friendshoring notwithstanding, presents a growing risk in view of populist protectionism and/or increasing competition from both the global east and south. To maintain Canada’s position in the US market, and to develop a much stronger place in high-growth markets, Canadian exporters need to become more innovative and outward looking.
Technology: Information technology is transforming virtually every aspect of economic and social behaviour, and is the platform on which virtually all other leading technologies depend. Given transformative developments in artificial intelligence and automation, combined with application of information technology throughout the materials and life sciences, the world appears to be on the verge of a new industrial revolution. Although individual Canadians are among the leaders in digital skills, Canadian small and mid-sized firms have for years invested much less per worker in IT than do their counterparts in the United States and several other advanced countries12. The gap is especially large in software and data bases which now constitute the leading edge of IT-based innovation and are likely to be the principal drivers of future productivity growth.
Environmental Sustainability: As steward of a vast territory and a resource-based economy, Canada bears a dual ethical and commercial responsibility to be among the world leaders in the transition to environmentally sustainable growth, and in particular the transformation of energy generation and use to forms that do not emit greenhouse gases. In 2022 fossil energy products accounted for $203 billion of export revenue—26% of Canada’s goods total. This revenue is at great risk in the medium-term as the world turns to non-emitting energy sources that are not only more environmentally sustainable but also becoming cheaper. The threat to Canada’s economy can be mitigated and transformed into new market opportunities, but only through innovation and enormous investment in technology, including in methods to sharply reduce emissions in the oil and gas sector. The open question is whether the motivation to innovate created by this combination of threat and opportunity, as well as by government fiscal incentives, will be sufficient to overcome a hard-nosed belief that demand for traditional Canadian fossil fuel resources will remain strong throughout corporate planning horizons.
Population ageing: The latest population growth projections by Statistics Canada, under a range of low to high assumptions regarding fertility and immigration, imply that the working-age population (those aged 15 to 64), as a proportion of the total, will decline steadily from 66% in 2021 to between 58% and 61% by 2068 with total population projected to range very widely between 46 and 74 million. Other things being equal, business will find labour markets tightening. The net effect on the labour market is nevertheless hard to predict in the face of sharply higher planned immigration and the fact that many of today’s jobs are vulnerable to automation. This raises the prospect of technological unemployment, at least during a significant transition period. Canadian business will face a growing challenge to innovate, either to stay at the leading edge of automation or to find ways to increase productivity if labour supply tightens.
These four megatrends, which are well established and gaining momentum, are of particular significance for the strategy of Canadian business in view of Canada’s outsized reliance on the US market, lagging investment in information technology, the prominent environmental footprint of the Canadian economy, and the productivity imperative implied by demographic changes. Together, these trends appear destined to profoundly disrupt Canada’s low-innovation equilibrium.
The big challenge is that it will not be easy for Canadian business as a whole to make the transition from the low-innovation business strategy to which it has become adapted with great success for well over a century. This multigenerational experience has deeply imbued a particular set of assumptions, habits, and competencies that constitute the Canadian business culture and that will require powerful incentives to change. By far the most compelling incentive will come from the market itself, reflecting the challenging environment outlined above. But public policy also has an essential role to play through the influence of government on market forces, and on setting institutional conditions that will give Canadian companies the best chance to succeed.
Question 4: What should be the government’s priorities to help keep Canada in the growth peloton?
A sense of proportion is required when considering this question. Direct government fiscal support, while significant for some industries and companies cannot, and should not, be expected to constitute more than a perturbation on the course of a $2.5 trillion economy. The fact that business decision making is dominated by market forces was well expressed by Mr. V.O. Marquez, who at the time (1972) was CEO of Northern Electric—the forerunner of former telecom equipment giant, Nortel:
“It is uncertain whether any incentive plan to stimulate the growth of domestic technology and innovation, or to make corporations expand aggressively into foreign markets, can deliver significant success when applied to companies in which the drive to do these things has not already been forced to emerge because of exposure to a real stimulus from the economic environment.”
There are nevertheless a great many forms of direct government assistance to business in Canada—tax expenditures related to accelerated depreciation of certain capital equipment, and the $3.2 billion R&D tax credit; direct funding via programs like the Strategic Innovation Fund, Global Innovation Clusters, and grants under the Industrial Research Assistance Program (IRAP); tailored support for certain sectors like agriculture and resource extraction; investment support for venture capital, targeted investment tax credits, and the new Canada Growth Fund; support from the Regional Development Agencies, the Business Development Bank, Export Development Corporation, the National Research Council, etc.; plus other supports delivered through provincial governments. The list can be bewildering and the aggregate dollar value of assistance is perhaps impossible to assess. But it would be at most a few tens of billions of dollars annually13. This is to be compared with total business revenue in 2022 of $5,450 billion and after-tax profit of almost $500 billion. But if strategically applied, direct fiscal support can yield a return that well exceeds the cost of public funds employed.
That said, by far the most significant impact of government on economic performance relates to the quality of the overall institutional framework, primarily along three dimensions noted earlier—i.e., institutions, together with related policies and programs that:
- Enhance the capabilities of every person and thus promote skills equality of opportunity;
- Ensure against arbitrary actions that amplify economic risk;
- Provide competent, non-corrupt government
Canada is generally regarded as among the global leaders in respect of the quality of its public institutional framework. For example, a recent ranking compiled by The Global Economy organization (which aggregates business and economic data from a range of official international sources) placed Canada 1st or 2nd among G-7 countries on several key dimensions of institutional quality of importance for economic performance, in each case surpassing the US. Although ranking exercises of this kind involve factors that defy objective quantification, they are directionally meaningful. It is likely that the quality of Canada’s public institutions—relative to peer countries in the growth peloton—partly compensates for shortcomings in business innovation.
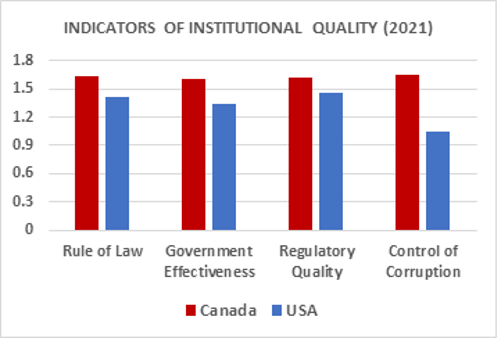 Source: The Global Economy organization
Government’s most important contribution to long-run economic performance is to ensure the continuing integrity and vitality of the institutional framework outlined above.
This is necessary, but not sufficient. To sustain Canada’s position in the growth peloton in a future shaped by globalization, technology, environmental sustainability, and demographic ageing will also require public policies more intensively focussed in at least the following five areas:
- Diffusion, adaptation, and extension of innovation and best practices: These are the processes by which the growth convergence in the peloton is established and sustained. As a smaller country, Canada must be expert in absorbing and adapting the best techniques the world has to offer. The fact that Canadians make up only one-half of one percent of the world’s population implies that the great majority of relevant innovation will not be home grown. So success depends on being a very quick follower and enhancer of innovation and best practices that originate elsewhere. This is aided by liberalized investment and trade (including between provinces!) and more intensive international engagement on both political and commercial fronts. Domestically, even greater priority should be given to innovation diffusion via the new Canada Innovation Corporation, the fledgling Canada Digital Adoption Program (CDAP), and other diffusion assists aimed particularly at smaller businesses.
- Formation of highly qualified people: Leading-edge human skills are the means by which technology and best practices are applied in the economy (point 1 above). They constitute Canada’s absorber capacity within the peloton. That’s why the most important domestic return on Canada’s large public investment in academic research is not its direct commercialization but rather the essential role the conduct of this research plays in training advanced students at the leading edge of knowledge, a foundation that is then further developed and applied throughout their careers. These skills, in turn, need to be complemented to a much greater extent in Canada by applied technical training in vocational schools and community colleges.
- Selection and integration of immigrants: Canada’s commitment to welcome continuing high volumes of immigrants is needed to offset the drag on economic growth created by an ageing domestic population. Increased immigration, currently targeted at half a million annually, will have the added benefit of deepening linkages with parts of the world with high future potential for growth. Canada’s points-based selection procedure for economic-class immigrants, and tradition of multiculturalism, constitute a significant advantage relative to peer countries. The challenge requiring policy creativity is to select and integrate extremely large flows in situations already strained, at least in the near to mid-term, by available housing and appropriate job opportunities. The latter nevertheless presents win-win opportunities through selection criteria that prioritize higher skills and complemented by accelerated recognition of foreign professional credentials.
- Regulation that is consistent with economic and climate objectives: Stated bluntly, it is taking far too long in Canada to get things done. The problem is pervasive across policy domains, all levels of government, and from small municipalities to the largest cities and the land mass beyond. Excessively zealous regulation, slow permitting, and endless consultation are usually the culprits. While a particular measure, considered in isolation, may appear to be appropriate, the systemic consequences are rarely considered, often because they spill across jurisdictions. For example, the problem has become acute regarding the role of regulation in coping with climate change. To have any hope of meeting Canada’s 2030 objective of reducing GHG emissions by 40% (from the 2005 level) it is urgent to accelerate siting of wind and solar facilities at scale, to expand the electric grid, and to manage the reduction of emissions from fossil energy production and use without tanking regional economies. Tough trade-offs are unavoidable and will need to be faced quickly because the global energy transformation is unstoppable for economic reasons and not only for climate concerns. Canada needs to be among the leaders as “green growth” –including, for example, new mines and processing facilities for critical minerals—replaces a great deal of traditional activity. Today’s regulatory philosophy and approach are currently not nearly up to the task.
- Rebuilding the subject matter expertise of the public service: Over the last several decades governments in Canada and elsewhere have gradually out-sourced more and more technical functions to consultants and other external agents, and in the process have severely eroded internal capacity to inform policy analysis. While reliance on external specialists will often be appropriate, relevant deep expertise is still required inside government to set agendas for external agents and to critically interpret their advice, as well as to develop independent views and institutional memory. This atrophied capacity needs to be rebuilt. Meanwhile, governments have come to rely heavily on lengthy consultation and engagement with all manner of “publics” that often have narrow perspectives. Obviously, there is an essential role for consultation with potentially affected parties, but this cannot be allowed to become a reason to avoid tough and timely decisions. Governments need to rebuild the internal capacity to knowledgeably listen, challenge, analyse, and decide.
JSGS Policy Brief continues below advertisement.

Conclusion
The analysis in this essay, looking forward, suggests that despite being a charter member of the “growth peloton” all is not well with the Canadian economy nor is government doing all it can or needs to do. The four megatrends summarized earlier present an enormous challenge to Canadian business, and government has an essential role in helping to meet that challenge. But by far the greatest responsibility rests with business itself. The biggest impediment arises, ironically, from the very success of Canada’s business strategy over the past 70 years or more. This has embedded habits and assumptions that will be hard to dislodge. The reality is that the dominant Canadian business strategy—with its low-innovation equilibrium—will not change in response to the exhortations of governments, consultants, and pundits. Canadian business strategy will change when, and only when, conditions in the market force it to change.
Peter Nicholson

Peter Nicholson has served in numerous posts in government, business, and higher education. His public service career included positions as Clifford Clark Visiting Economist in Finance Canada; Deputy Chief of Staff, Policy in the Office of the Prime Minister; and Special Advisor to the Secretary general of the OECD. Dr. Nicholson’s business career included senior executive positions with Scotiabank and BCE Inc. He retired in 2010 as founding president of the Council of Canadian Academies, an organization that conducts expert panel studies of scientific issues related to public policy. He is currently the Chair of the Board of the Canadian Climate Institute. Dr. Nicholson is a Member of the Order of Canada and the Order of Nova Scotia and is the recipient of five honorary degrees.
Annex: Growth Rate Convergence from a Cross- Nation Perspective
A great deal of large-scale social and political history can be seen through the graphical lens of relative GDP per capita. This is illustrated in the following charts where various countries’ GDP per capita (converted into US$, inflation-adjusted) is traced as a percent of US GDP per capita14. In these charts an upward-sloping line corresponds to times when the country’s growth exceeds that of the US, whereas a downward-sloping line corresponds to the opposite. A flat portion of the trend line signifies per capita growth equal to that of the US during the corresponding time.
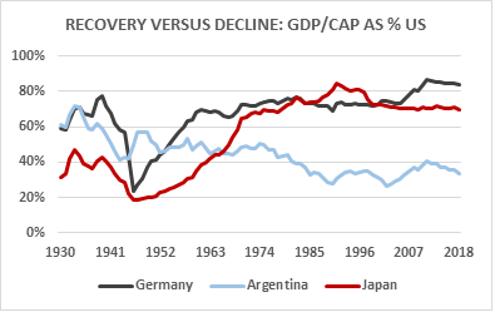
Once a country has joined the leaders in the growth peloton it takes a very large shock to knock it out of the pack. That happened to Germany and Japan, and to a lesser extent to the UK, as a result of WW II. But with the help particularly of the US, the war-torn countries were already back in the leading group by the late 1960s. Argentina, on the other hand, was among the rich countries in the late 19th and early 20th centuries, but failed to keep pace beginning in the 1930s and has never been able to rejoin the pack. In Argentina’s case, severely dysfunctional politics became entrenched and prevented the sort of recovery experienced by post-war Japan and Germany.
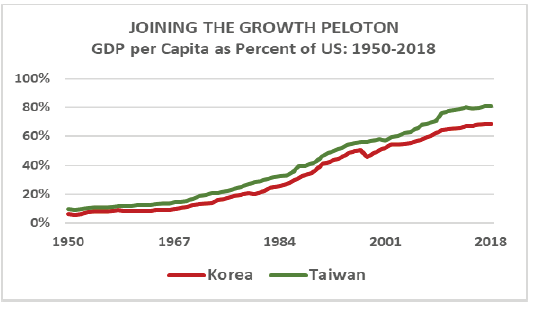
South Korea and Taiwan provide spectacular examples of very poor countries that, beginning in the 1950s, embarked on a 60-year period of sustained high growth which brought them into the peloton with a GDP per capita between 70-80% that of the US. These “Asian Tigers” were beneficiaries of focussed American support thanks to Cold War geopolitics but eventually complemented this with domestic institutions that provided the foundation for sustained growth, particularly a commitment to education and sound macroeconomic policies.
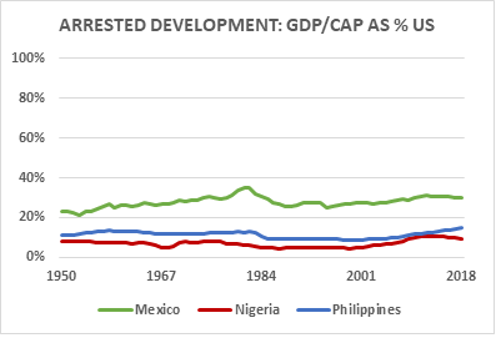
Unlike South Korea and Taiwan, that went from poor to rich in just a few decades, most of the so-called developing countries have yet to achieve the period of break-out growth that would bring them into the peloton. For example, the Philippines, long under American influence, might have grown as Taiwan and Korea did but the country has failed to evolve the institutional integrity to support “catch-up” growth. Even Mexico, despite the economic benefit of adjacency to the US, amplified by NAFTA, remains mired with a per capita GDP only about 30% that of the US. And per capita output of oil-rich Nigeria has remained at most 10% of the US benchmark for the last 70 years or more. Note however that these chronic underperformers have grown at the same rate as the leaders—i.e., maintained a level of per capita GDP as an approximately constant percentage of US GDP for many decades. This shows that there is steady transmission of investment and innovation to even the poorest countries. But they have not been able to ignite the multi-decade period of high growth needed to join the rich country peloton.
Why? The reasons are debated endlessly by scholars of economic development. The relevant factors vary from case to case—e.g., a legacy of colonialism; exploitation by powerful countries and corporations; exceptionally challenging environmental conditions; irreconcilable ethnic or religious conflict. In virtually every case, such underlying factors have become embedded in severely dysfunctional politics, whether overtly authoritarian or nominally democratic. When rotten politics becomes locked-in, it undermines the quality and integrity of the domestic institutions that are necessary to sustain a period of break-out growth.
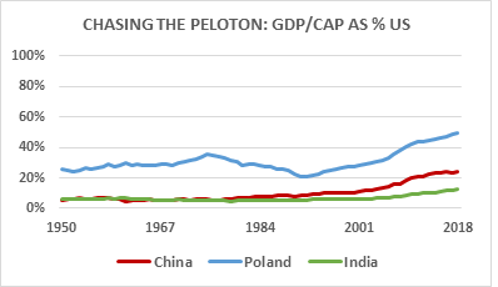
Several countries appear today to be on a rapid growth path that would lead them eventually into the peloton—e.g., China is well on its way despite some recent hiccups and India appears finally to be on track. The same is true for countries from the post-Soviet bloc such as Poland, as maybe also Indonesia, Vietnam, Turkey, among several others. But there remains the risk, even in China’s case, of stalling well short of the leading group should political dysfunction undermine the institutional foundations of economic performance.
Endnotes
[1] There are several theoretical approaches that seek to account for certain empirical regularities in long-term economic growth via various mathematical formalisms, but they are based on assumptions that are rooted in particular institutional circumstances. There is no suggestion that these theories possess anything like the universality, permanence, and precision of, for example, the law of universal gravitation.
[2] There is an extensive academic literature on the question as to whether or not the growth rates of all countries are, or should be, converging to a common value, and if not, why not. It is accepted as an empirical fact that the growth rates of GDP are very nearly the same on average within the group of high income countries, but there is very substantial variation of growth rates and levels of GDP per capita among middle and low income countries.
[3] “Peloton” is of French origin, literally meaning “ball” but used to refer to a group or squad.
[4] There are exceptions—e.g., Norway’s GDP per capita has been as high as 150 % that of the US, having increased rapidly from about 80% in 1990 after which North Sea oil generated huge revenue. Resource bonanzas can stimulate very rapid growth—e.g., as experienced by Alberta, Saskatchewan and Newfoundland and Labrador—but may not be sustainable over the long-term. Switzerland illustrates a different model and is regarded as a world innovation leader with per capita GDP that is currently steady at about 110% of that of the US. Still, there are regions of the US that are larger than Switzerland and have greater GDP per capita. In every case, national averages conceal a great deal of regional variation.
[5] Looked at this way, the fact that Country X (say, Canada) has a GDP per capita that is 80% that of the leader (say, the US) means that Country X is some number of years “behind” the leader. For example, at a common sustained growth rate of 3% per year, Country X would be about 7.5 years behind the leader—i.e., whatever the leader’s GDP per capita was at the start of 2023, Country X would have reached that level 7.5 years later (the middle of 2030).
[6] The source for international data on GDP per capita used in this paper is the Maddison Historical Statistics Project headquartered at the University of Groningen in the Netherlands. This is regarded as the most reliable source for cross-country comparison over longer time periods. Other sources such as the World Bank, IMF, and OECD, as well as national statistical agencies, will usually produce slightly different results where coverage overlaps. This is due to comparatively minor differences in methodology regarding conversion of domestic monetary units to a common currency and from current prices to fixed-year prices. Such differences do not affect the qualitative messages in the “Maddison” data.
[7] We define the employment ratio as the number of (compensated) hours worked in the total economy divided by the total population. (The chart is based on data from the Centre for the Study of Living Standards.)
[8] The growth rate of the product of two factors (A*B) is equal to the sum of the growth rates of A and B.
[9] Innovation takes both tangible and intangible forms. For example, innovation in machinery design and performance is incorporated in the economy via tangible capital investment, whereas more efficient production processes (e.g., just-in-time inventory management, or Amazon’s fulfillment system) represent intangible innovation. Both types enable more output value per hour worked.
[10] For example, based on an aggregate indicator of “innovation” developed by The Global Economy organization (2022), Canada is ranked 6th in the G-7 and 15th overall, well behind the leaders, Switzerland and the US. Canada’s aggregate innovation metric has declined almost every year since 2013, with the lowest being in 2022.
[11] In the 2021 ranking by the Boston Consulting Group of the world’s 50 most innovative companies, none were headquartered in Canada. While such rankings are far from “scientific” they provide a meaningful indicator of how the innovativeness of the Canadian corporate sector is perceived internationally.
[12] The federal government has recently established the $4 billion Canada Digital Adoption Program (CDAP) which provides small grants, interest-free loans, and advice to build the digital capabilities of small and medium-size companies.
[13] According to the federal government’s Fiscal Reference Tables (2022) federal program spending in 2021-22 was $465 B of which about half was direct transfers to persons and other government. Of the $235 B remainder, $88 B was transfers of all other types, much of which would not go to businesses.
[14] The source for the GDP data is the Maddison Historical Statistics Project, headquartered at the University of Groningen in the Netherlands.