

Ponzi Schemes and Intergenerational Equity: The Challenge of Canada’s Senior Promise
Established in the 1960s to provide old age security through the Canada Pension Plan and other income support programs, Canada's "Senior Promise" is considered a pillar of Canada's social safety net. But its pay-as-you go system of finance, not unlike a Ponzi Scheme, presents Canada with deeply rooted fiscal and demographic challenges.
By Don Wright, former Deputy Minister to the Premier of British Columbia and former Saskatchewan Government Deputy MinisterIntroduction
Download the JSGS Policy Paper
Download the Disussion Questions
In the 1960s and 1970s Canadian governments put in place what can be called Canada’s “Senior Promise”. It was founded on the notion that government funding to provide old age security and other income support programs, high quality health care and subsidized long-term care, will always be there.
Now there is a common recognition that the Senior Promise will increasingly strain government budgets as the last of the Baby Boom Generation (Boomers) retires. Yet there is little indication that governments are prepared to implement measures that would put the Promise on a sustainable footing.
Instead, what the recent Trudeau government did was to significantly increase immigration levels, claiming this would counter the aging Boomer problem by expanding the pool of the tax-paying labour force, along with other purported benefits.
This brief will show that this proposed solution is not a solution at all, but rather just continues what is effectively a Ponzi scheme. All Ponzi schemes, based on new investors paying off earlier investors, eventually collapse. Unless real corrective measures are taken in the near future, Canada’s Senior Promise will not escape that fate.
The Origins of the Senior Promise
Prior to the 1960s, Canadian governments provided very limited support for seniors. There was no Canada Pension Plan (CPP). Old Age Security (OAS) payments were paid only after the age of 70, and were widely acknowledged as inadequate to support seniors who had no other source of income. By 1961, publicly funded hospital services – cost shared 50/50 between the provincial and federal governments – were available in all provinces, but only B.C. and Saskatchewan provided the broader range of health services we now associate with Medicare. Public funding for long-term care was virtually non-existent.
In the mid 1960s the Pearson government, working cooperatively with the provinces, brought in significant changes that became the core of Canada’s Senior Promise. The CPP was established in 1965. The eligible age for OAS was lowered from 70 to 65 between 1966 and 1970. A Guaranteed Income Supplement (GIS) to top up the OAS for seniors who had limited additional sources of income was introduced in 1967. The 1966 Medical Care Act provided federal funding for comprehensive provincial health care plans, and by 1971 all provinces had implemented these plans. Subsidies for long-term care developed less consistently from province-to-province, but on average public money provides approximately 70 percent of the cost, with the balance paid by the seniors or their families.
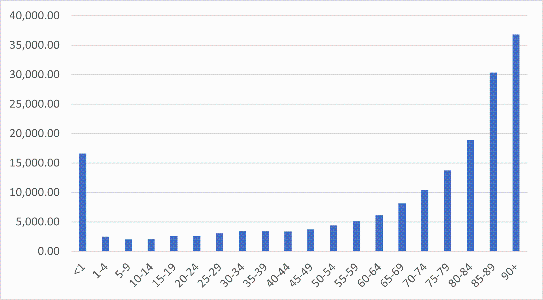
While health care coverage is, of course, available to all age groups, the incidence of expenditures is very heavily weighted to seniors, so it is appropriate to consider the provision of health care a core part of the Senior Promise. In 2022 the 65-and-older age group was 18.7% of the Canadian population, but accounted for 46.7% of total expenditures on health. Figure 1 below shows 2022 per capita expenditures by age group.
Who would pay for the Senior Promise?
The Senior Promise was to be paid largely on a “pay-as-you go” basis – i.e., annual expenditures would be funded out of each year’s government budgets, with virtually no provision for future expenditures.
The qualifier “virtually” allows for the fact that a fund was set up for the CPP, with the notion that this would fund future pension liabilities. But the premiums established were nowhere near sufficient to fully fund future obligations. For its first 20 years the contributions were only 3.6% of pensionable earnings - by comparison this year the contribution rate is 11.9%.
Furthermore, the fund was not invested primarily to maximize long-term returns. Rather it was invested almost exclusively in government bonds – it could be argued the CPP subsidized government borrowing costs. By the early 1980s the fund’s assets began to fall, and were projected to be completely depleted by 2003.
So, while the CPP wasn’t completely funded on a pay-as-you-go basis, its premiums were perhaps only one-third of what would have been necessary to properly fund the future pensions on an actuarially sound basis. To his credit, then federal finance minister Paul Martin spearheaded significant reforms putting the CPP on a sounder basis going forward in 1998.
From a generational point-of-view, the CPP was a very generous deal for those whose primary working years were the 1960s through 1998. For those whose primary working years were/are after 1998, not so much.
All of the other parts of the Senior Promise – OAS, GIS, publicly-funded health care and long-term care – were explicitly funded on a pay-as-you-go basis. In other words, it would be current taxpayers who pay the expenses each year. The incidence of this will fall heaviest on those working. Seniors do pay income and other taxes, but their average income falls upon retirement, and they also benefit from additional tax credits for age and pension income.
So, the Senior Promise was, from the beginning, a transfer from Canadians of working age to seniors.
Why did governments decide on a pay-as-you-go approach?
To understand why Canada decided upon a pay-as-you-go approach, it is useful to understand what the age structure of the Canadian population looked like in the 1960s. Figure 2 below shows a very simplified population pyramid for Canada in 1965.
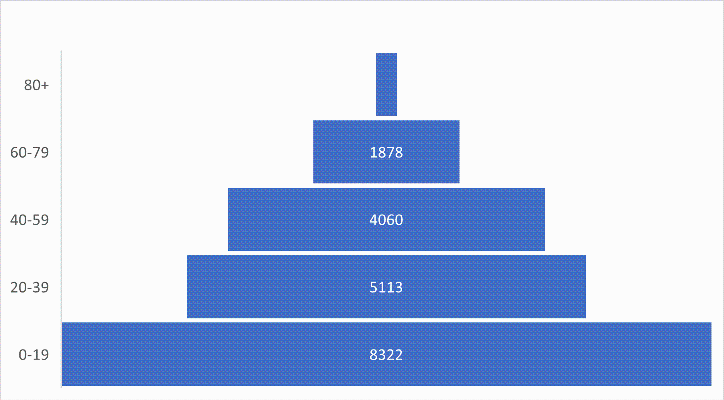
Figure 2: Canada Population by Age Group, 1965 (000s)
Source: Statistics Canada 17-10-0005-01
In 1965 the population 65 and older was only 7.6% of the total population. There was an historically large cohort in the 0–19-year age group (the Boomers), and at the time it would have seemed absurd to suggest that anything like the fertility decline we have seen since the 1960s was on the horizon.
In such circumstances, it may have seemed reasonable to pay for the Senior Promise on a pay-as-you go basis. The apparent burden on the currently working population did not seem overly burdensome because of the relatively small proportion of seniors in the population. Furthermore, it was portrayed as a fair reward for those who had contributed to the Allies’ World War II victory and the incredible postwar increase in Canadian prosperity.
While on the surface this decision may have seemed reasonable, there was a time bomb embedded in it. To maintain the same relatively light burden on the working population, the 1965 relative age-proportions of the population would have to be reproduced in perpetuity. It would not be sufficient for the Boomer numbers to be reproduced over time, but rather that each succeeding generation would need to be similarly larger relative to the preceding generation as the Boomers were to the generation that preceded it.
There is a subtle, but absolutely essential, distinction to be made here. Most of the discourse around Canada’s aging problem has focused on the number of the Boomers, and the fact that Generation X after it was smaller. But that is not the real problem. The problem is that Generations X, Y and Z were not the same multiple of the generation preceding each of them as the Boomers were of the generations preceding it.
To demonstrate the significance of this, let’s compare Canada’s current population pyramid with the pyramid that would have reproduced the proportions of 1965. The simplified pyramid in 2024 is shown below in Figure 3.
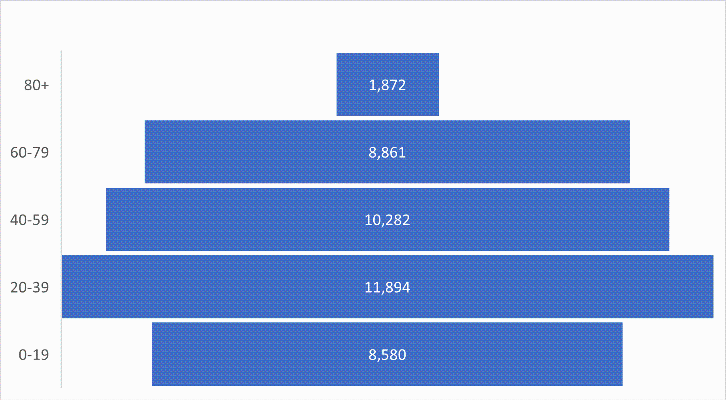
Figure 3: Canada Population By Age Group, 2024 (000s)
Source: Statistics Canada 17-10-0005-01
The 60-79 age group in 2024 is essentially the Baby Boom Generation.
1So, to reproduce the relative proportions of 1965, let’s see what the population pyramid would look like in 2024 if all other age groups had the same relative size to the 60-79 age group as each had in 1965. Such a pyramid is shown below in Figure 4.
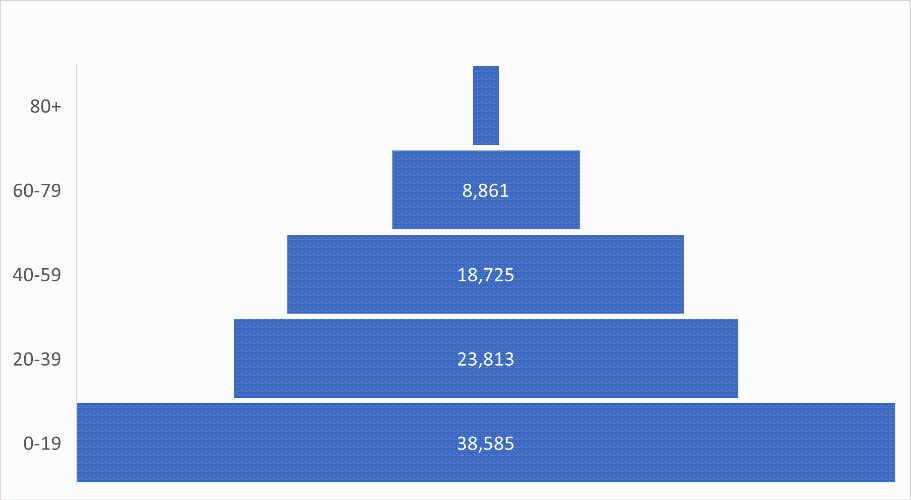
Figure 4: 2024 Population Pyramid Reproducing the 1965 Proportions (000s)
Source: Statistics Canada 17-10-0005-01
A quick visual comparison between Figures 3 and 4 shows a striking difference in age structure. Two points in particular need to be noted.
First of all, the total population in Figure 4 is 91.2 million, compared to the actual 2024 population of 41.3 million. This reflects the necessity, explained above, for each succeeding generation to be as much larger, relative to the preceding generation as the Boomers were to the generation that preceded it. To maintain the proportions of 1965, Canada’s population would have to double every 27 years – in essence each generation would need to be twice the size of its parents’ generation. And this preposterous rate of growth would need to continue – by 2050 Canada’s population would have to grow to 180 million, and by 2100 it would have to grow to 660 million.
What we are describing here is, in essence, a Ponzi scheme (See box).
|
“A Ponzi scheme is an investment fraud that pays existing investors with funds collected from new investors. Ponzi scheme organizers often promise to invest your money and generate high returns with little or no risk. But in many Ponzi schemes, the fraudsters do not invest the money. Instead, they use it to pay those who invested earlier and may keep some for themselves. With little or no legitimate earnings, Ponzi schemes require a constant flow of new money to survive. When it becomes hard to recruit new investors, or when large numbers of existing investors cash out, these schemes tend to collapse.” United States Securities and Exchange Commission |
Referring to the Senior Promise as a Ponzi scheme is not meant to imply an actual fraud, but that the arithmetic is totally consistent with what happens in a Ponzi scheme. If Canada’s population does not grow at the rate that would double every generation – and of course it hasn’t and it won’t – the pay-as-you-go approach to funding the Senior Promise inevitably consumes a larger and larger share of national income.
The burden of this Ponzi scheme was further increased by the second point that should be noted. The 80+ population in Figure 3 is significantly larger than the 80+ population in Figure 4. The scenario maintaining 1965 proportions assumes there had been no increase in life expectancy after reaching 65. But of course, there has been – by approximately 6 years. The population would have to grow at an even greater rate to accommodate this within the Ponzi scheme. But in the interest of brevity, we will leave that for now – the point of the preposterous rate of population growth to keep the Ponzi scheme going has been made.
Did governments in the 1960s know they were setting up a Ponzi scheme? Or did they implicitly believe that the age structure circa 1965 could be maintained indefinitely, not understanding the preposterous population growth rates this would require? Or was the truth somewhere in between these two extremes - that policy makers were aware that future governments would have to make adjustments, but that was something for future governments to worry about?
While it is interesting to speculate about what was in policy makers’ minds back in the 1960s, that is largely irrelevant to our path going forward. We are where we are, and we need to grapple with the Ponzi scheme we have inherited.
The solution that will not work
As mentioned in the introduction, in its first term, the Trudeau government significantly increased the rate of immigration into Canada. This had been championed by The Century Initiative, whose founders and board members over the years have been prominent business and political leaders.2 Some of these leaders played a prominent role in the Advisory Council on Economic Growth set up in the first term of the Trudeau government. A core recommendation of that body was to ramp up Canadian immigration levels significantly – to 450,000 by 2021 (in 2015 the number of people granted permanent resident status was 272,000). The government acted on this recommendation almost immediately.
The most frequently cited argument in favour of high immigration is that it is essential to deal with Canada’s aging population. At a superficial level, this argument seems plausible, which is why it is accepted almost as an article of faith. It is true that that the age distribution of immigrants skews younger than that of the general population – by approximately ten years on average - as shown in Figure 5 below.
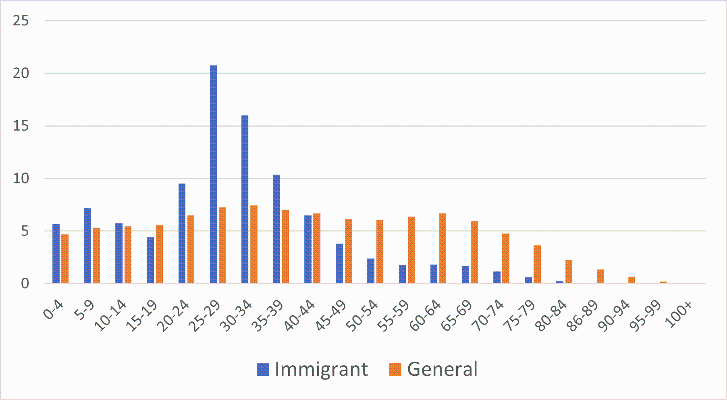
Figure 5: Age Distribution (Percentage) General Population (2023), New Permanent Residents (2023/24)
Source: Statistics Canada 17-10-0014-01 and 17-10-0005-01
But the argument is only superficially plausible. People don’t stay young forever. Immigrants of working age who arrive in Canada today will, in time, also reach retirement age. They then add to the public purse challenge of supporting seniors.
To determine the validity of this argument, we need to look past a snapshot at one point in time and look at how Canada’s age structure would evolve through time. A CD Howe Institute study by Robson and Mahboubi (R&M) in 2018 did that.3 In that study R&M did a number of simulations between 2017 and 2067 testing different assumptions about immigration levels and retirement ages. One of the key indicator tracked in these simulations was what happens to the Old-Age Dependency (OAD) ratio – the ratio of the past-the-retirement-age population to the working-age population. In 2017 this ratio was 26.4 percent.
R&M developed a baseline scenario in which immigration levels continued at the pre-Trudeau percent of population. Another scenario had immigration rise at the rate recommended by the Advisory Council on Economic Growth. By 2067 the OAD ratio in the baseline scenario rose to 36.3 percent; under the higher immigration scenario it rose to 33.8 percent. So, the higher immigration scenario does mitigate the aging problem somewhat. But it does not fix the fundamental problem. As R&M explain:
“The limited effects of immigration on demographic structure are different from what many people imagine, so it is worth emphasizing that the momentum of aging in the already-resident population – and in each cohort of immigrants as they too age – is very hard for immigration to counteract.”
To further emphasize this point R&M calculated the levels of immigration required to stabilize the OAD ratio. They calculated that immigration levels would have to rise to such a level that Canada’s population in 2067 would be 156.2 million – 4.26 times its 2017 level.4 R&M wryly observe:
“That preposterous scenario illustrates a sensible point: hopes that immigration can offset demographic aging in Canada do not survive an encounter with the numbers.”
And yet the hopes not only survive, but appear to continue to dominate the thinking of the current federal government. In its platform in the recent election, there was some acknowledgement that the “previous government had let immigration levels grow at a rapid and unsustainable place.” But the promises going forward don’t look all that different from the Trudeau-era Liberals.
There is a commitment to cap temporary foreign workers and international students at 5% of the population. The equivalent number at the end of 2015 was 2.3%.
With respect to new permanent residents, the commitment is to “stabilize permanent resident admissions at less than 1% of Canada’s population beyond 2027.” Between 2000-15 the annual intake was never more than 0.83% and averaged 0.76%. So, “less than 1%” doesn’t sound like a significant tightening. The difference between “less than 1%” (say, 0.99%?) and 0.76% would mean an additional 100,000 new Canadians per year at current population levels.
A perhaps not too cynical take on this is that the objective is to keep the Ponzi scheme going as long as possible. Higher immigration is analogous to recruiting “new investors” to pay off the “early investors.”
There is a significant generational equity issue here. The “early investors” are the Boomers. The “new investors” are Generations Y and Z. This is clearly unfair within the context of the Senior Promise alone. But, in addition to that, younger Canadians are further adversely affected by the impacts on housing and labour markets.
As pointed out above, immigration skews heavily to the 20-39 age group. What happens in those years is critical in determining whether Canadians will have a comfortable, fulfilling life, and a secure retirement. Those are the years when careers get launched, when families get formed, when young Canadians hope to get a foot on the first rung of the housing ladder, ultimately leading to an affordable house appropriate to the size of family they desire to have.
Aggressive levels of immigration mean that Canadians in the 20-39 age group face more competition on the supply side of the labour market – a “cheap labour strategy” - and on the demand side of the housing market, leading to lower wages and salaries and less affordable housing.
If you are a house-owning Boomer,5 on the other hand, the supply and demand impacts of high immigration levels have worked to your advantage. The cheap labour strategy has meant that the services you want will generally be less expensive. And, you are sitting on significant unearned capital gains from the impacts on the housing market.
Most significantly, the narrative that keeps focusing on higher immigration as the solution to the aging Boomer problem keeps the Ponzi Scheme running, which means policy makers aren’t turning their attention to the notion that perhaps all generations need to contribute to fixing the problem.
The policy path to solve the Ponzi problem
There are two paths to solving the Ponzi problem. One would entail a balanced set of changes that would ask Canadians of all ages to contribute to putting the Senior Promise on a sustainable footing. In broad terms that would include:
- A renewed focus on policies that will engender healthy year-over-year real wages akin to what Canada experienced in the first thirty years after World War II. This would lessen the relative tax burden on working Canadians in supporting the Senior Promise;
- Reforming Canada’s health care system to provide better results for the public funding provided. Our thinking in Canada has been made lazy by comparing our system only to the U.S. system. If we look at the systems in other OECD countries, we don’t look so good;
- A tighter needs-based lens on seniors programs. High income seniors benefit from age and pension tax credits and OAS benefits that really cannot be justified, except on naked political grounds;
- Gradually raise the retirement/OAS eligibility age. The life expectancy at age 65 is 6 years longer now than it was in 1965. Seniors don’t just live longer, they stay healthier longer as well, and can be expected to contribute to the economy for longer.6
The alternative to measures such as these is to keep the Ponzi scheme going as long as possible, aided and abetted by the bogus idea that rapid population growth will fix the problem. The latter path will blow up sooner or later – all Ponzi schemes do. Before it blows up, the intergenerational inequity will only get worse and worse.
JSGS Policy Brief continues below advertisement.

Endnotes
[1] Augmented by net immigration between 1965 and 2024.
[2] https://www.centuryinitiative.ca
[3] See https://cdhowe.org/wp-content/uploads/2024/06/March-9-e-brief_274-Web.pdf
[4] R&M’s estimates of the population growth needed to stabilize the OAD ratio are of the same order of magnitude of those calculated above – essentially doubling every generation. The difference in the absolute numbers reflects the differing starting points for this doubling-per-generation process. R&M’s started in 2017; the calculations here started in 1965.
[5] True confessions: the author is in that category.
[6] For a deeper dive on these suggested changes, I discuss them in this post: https://donwright.substack.com/p/we-can-have-our-own-values-but-we
Don Wright

Don Wright’s career has spanned the academic, government and private sectors. He served as Deputy Minister to Premier, Secretary to Cabinet and Head of the Public Service for the Government of British Columbia in 2017-20. His other government service included positions as Secretary to Treasury Board and Deputy Minister positions in the Saskatchewan and British Columbia governments. Wright has also held positions as President and CEO of Central 1 Credit Union, President of the British Columbia Institute of Technology, and Vice President of a forest products company. He continues to be active in public policy discussions, provides advice to selected clients and sits on a small number of boards.
Currently, he is Senior Counsel with Global Public Affairs, Chair of the Board of ALS Action Canada, a Member of the Board of the BC Financial Services Authority, a Fellow with the Public Policy Forum, and a Senior Fellow with the C.D. Howe Institute.
Born and raised in Saskatchewan, he holds a PhD in Economics from Harvard University, an MA in Economics from the University of British Columbia, and a BComm from the University of Saskatchewan.